blog22-3

The Basics of Forex Theory An introduction to the Foreign Exchange, the Major Currencies and Reason

What is a Currency Pair ?

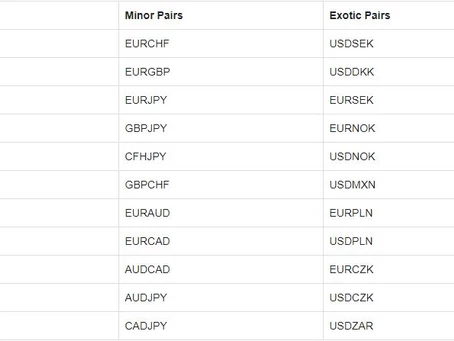
Currency is always measured against another currency and they are referred to as currency pairs. Currency pairs are generally segregated into groups. These groups are known as Majors, Minors and Exotics. Major currency pairs are generally the most popular traded currency pairs. Almost all currencies are free floated, meaning that they don’t have a set representation of value to another currency and can rise and fall in value independently. Some of currency pairs offered by Exness available for trading are:
Once you understand the basics, the next step is learning to read price movements — see our guide on Reading Forex Charts Like a Pro.


What is a Pip ?

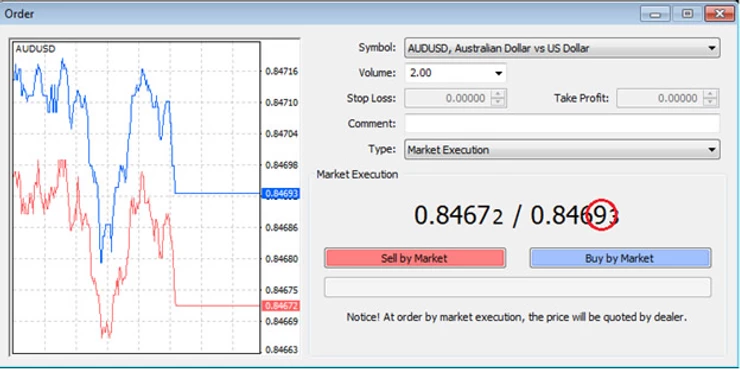
A pip is a small measurement of change in the underlying currency. Generally, it is the forth (0.0001) decimal place of a currency price, except with the Japanese Yen, where they have no denomination for cents in their currency (in the Japanese Yen, the pip is the second decimal place). Shown below is an image representing an order window reflecting the price of the AUD/USD Currency Pair

The fourth decimal place is circled red to show which decimal the pip is in reference to. If the price 0.84693 moves to 0.84683 then there was a 1 pip movement. Please note that the fifth decimal represents 1/10th of a pip.


A pip is a good reference measure to how much a trader can make based on the volume of their trades. For example, if a trader purchases a full contract the value of potential return and risk is $10 profit or loss (of the second named currency in a pair) per pip movement. You can follow the table below as a reference to potential risk or return:


Quite often, the annotation used to measure how well a trader is doing is to mention how many pips they have gained in a set time period.

What is Bid & Ask and Spread ?

With currency quotes, they are always represented with a Bid offer and an Ask offer. This denotes the price difference between buying and selling.

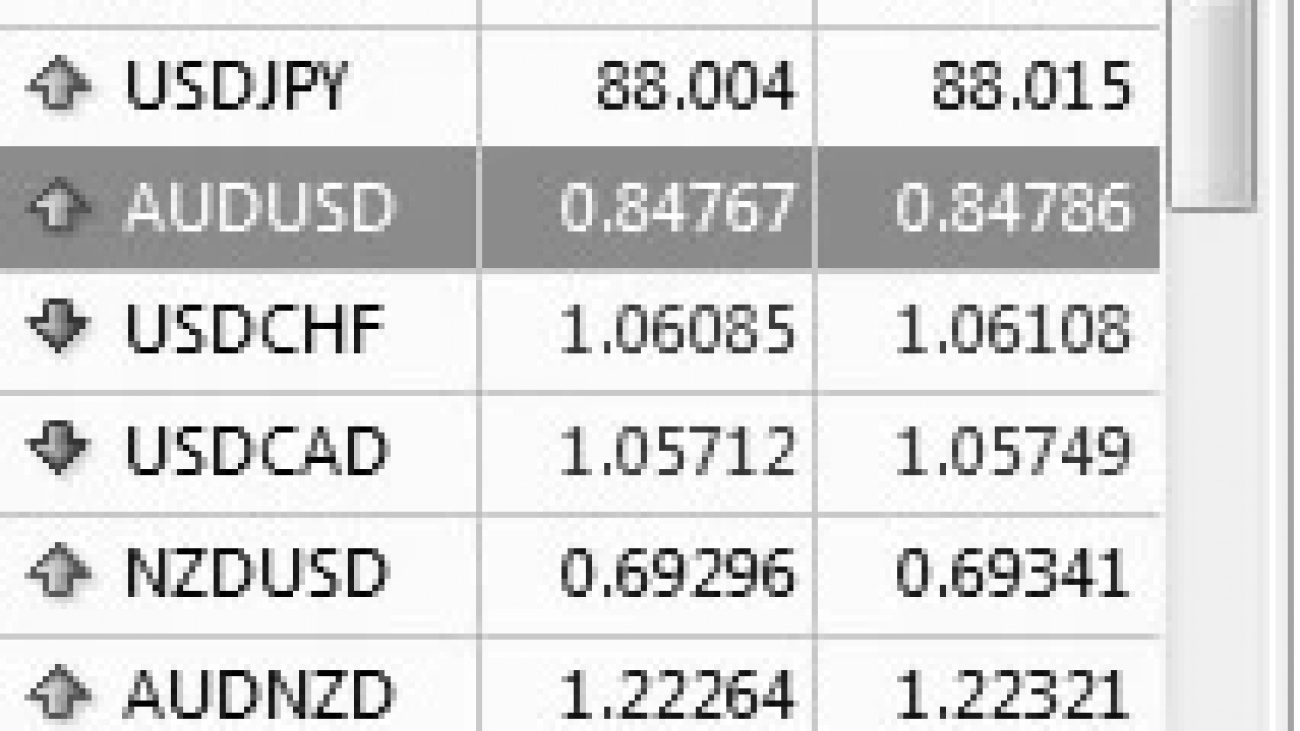
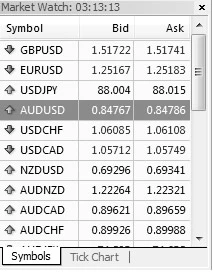
If you BUY, you are buying at the ASK price. if you SELL, you are selling at the BID price. Shown below is a list of currency pairs all showing a Bid and Ask offers.

Remember, if you opened a BUY position and you wish to close it, you are essentially selling it back, therefore the price you will be closing the position at is the BID price and vice versa.
To start applying technical analysis, learn how to use one of the most popular indicators in our article on How to Use the RSI Indicator in Forex Trading.

The spread is the pip difference between the BID and ASK. If you were to look at the above image and referred to the AUD/USD then you will notice the BID as 0.84767 and the ASK as 0.84786.

This is a spread of 1.9 pips. 0.84786 – 0.84767 = 0.00019 0.00019 = 1.9 pips

What is Leverage and How much do I need to trade ?

Leverage is the amount that you are borrowing based on the deposit in your account. Default leverage is set at 100:1, meaning that for every $1 you have in your account, you have a buying power of $100. If you have $1,000 in your account, you have buying power of $100,000. Something to remember is a full contract is $100,000 of the base currency. So if you were looking to trade a Full Lot of the EUR/USD, then you would need the equivalent of EUR$100,000 in your account to trade this. If you wanted to trade a full contact and you had a leverage of 500:1, then you could take this position with only $200 in your account ($200 x 500 = $100,000). High leverage can help you take larger positions based on smaller capital in your account, but it is not without its pit falls. Larger positions result in larger dollar movements per pip and as such can wipe out smaller capital amounts in a short period of time.
Ready to put theory into practice? Open a free Exness demo account and start trading with zero risk.


Frequently Asked Questions

Q: What is forex trading in simple terms?
Forex trading is the buying and selling of currencies in the global financial market. You profit by predicting whether one currency will rise or fall against another. For example, if you believe the Euro will strengthen against the US Dollar, you buy EUR/USD and sell when the price rises.

Q: What is a currency pair?
A currency pair is the price of one currency expressed in terms of another. In the pair EUR/USD, the Euro is the base currency and the US Dollar is the quote currency. The price shows how many US Dollars are needed to buy one Euro.

Q: What is a pip in forex?
A pip is the smallest unit of price movement in a currency pair. For most pairs, one pip equals 0.0001. If EUR/USD moves from 1.1000 to 1.1001, that is a one pip movement.

Q: What is leverage in forex trading?
Leverage allows you to control a large position with a small amount of capital. For example, with 1:100 leverage, you can control a $10,000 position with just $100. While leverage amplifies profits, it also increases risk significantly.

Q: What is the difference between fundamental and technical analysis?
Technical analysis uses price charts and indicators to predict future movements based on historical data. Fundamental analysis looks at economic news, interest rates, and geopolitical events to determine a currency’s value. Most professional traders use a combination of both.

Q: How do I start forex trading as a complete beginner?
Start by opening a free demo account, learn the basics of chart reading and risk management, and practice with virtual funds before risking real money. Open your free Exness demo account here.

blog20

Why Is Liquidity So Important?

Have you ever run into the word “liquidity” while reading a financial report? It’s a term that gets thrown around by forex analysts all the time. Understanding liquidity can help you choose the right order types, which leverageto use, and how long you should keep your orders open. Soon you’ll understand the relationship between liquidity and volatility. Take your trading skills to the next level with this introduction to liquidity.

So what is forex liquidity and why should you care?

Liquidity is a measure of how easily a forex currency pair can be traded. Investments that can quickly be converted into cash are said to have high liquidity. The forex CFD market is liquid by nature, and traders can open and close trades in just a few clicks.


In contrast, real estate investment is much less liquid—especially during times of economic uncertainty. People selling a property may have a long wait until they can convert their investment back into cash, which is probably why forex has become so popular as an investment vehicle. Since liquidity indicates a safer or less volatile investment option, you might want to build your trading skills by limiting your trades to high liquidity currency pairs.

How can you find high liquidity currency pairs?

So you’re looking for a currency pair that offers the benefits of liquidity. Trading volume is a good indicator of liquidity. Trading volume refers to the amount and size of the orders being placed on a given currency pair. The more volume, the more stable the price line. The eight currency pairs with the highest volume and therefore liquidity are: EURUSD (Euro vs US dollar)

USDJPY (US dollar vs Japanese yen)

GBPUSD (British pound sterling vs US dollar)

AUDUSD (Australian dollar vs US dollar)

USDCAD (US dollar vs Canadian dollar)

USDCNH (US dollar vs Chinese renminbi)

USDCHF (US dollar vs Swiss franc)

EURGBP (Euro vs British pound sterling)

So now you know which pairs are favorably liquid, but why is this important? To better understand how liquidity influence prices, let’s scale everything down. Imagine that the liquidity for EURUSD comes from just 100 traders. One day, five people don’t make any orders. Trading volume shows a drop of around 5%. Prices will adjust, but nothing major will happen on the market. Now let’s consider an exotic currency pair like USDSEK. This time, only 10 traders generate the liquidity. One day, five traders don’t make an order. Trading volume drops by around 50%. Prices will adjust rapidly, and dangerous volatility will follow.

It all starts with volume

Let’s look at a real world example to demonstrate how volume changes the behaviour of the currency and price moves. Imagine three vehicles. A car, a bus, and a ship. The car represents those currency pairs that don’t get a lot of trading volume. Cars can be fast, light, and more maneuverable. The car can rapidly swerve or change direction, and even turn around at a moment’s notice. Because of the  limited volume, you can expect a wild ride when trading the “smaller” currency pairs. The bus is a heavier vehicle and much less maneuverable, and it carries a much higher volume.  It’s not the most popular choice for traders, but the higher volume still offers a slower, less-volatile ride.

The ship is by far the slowest at making course changes. Ships have massive volume compared to other vehicles. These “bigger” currency pairs are traded by many, enjoy endless liquidity, and make for a much smoother ride.The eight listed currency pairs above could be considered “ships”. Major currency pairs have massive volumes, and a change in direction is usually slow. The charts appear smoother with fewer spikes. Simply put, the more liquidity, the more volume, the slower the price change. The exception to this is when something “big” happens. When a nation makes a political or economiceconomic announcement that traders perceive as “bad for business”, investors can make the same conclusion at the same time and abandon the vehicle, destabilizing it as they go..

Example: When the UK announced Brexit in 2016, GBP investors everywhere probably came to the conclusion that a non-EU destination would be economic suicide. GBP investors started jumping ship, and sterling started sinking. Some traders stayed loyal and hopeful, and they are now battling a stormy or volatile transition.

Top tip for high liquidity traders

Trading high liquidity pairs means you can use wider ‘Take Profit’ and ‘Stop Loss’ settings. You might also consider a higher leverage depending on how stable the currency pair is. When checking for price reversals, sharp moves can be misleading. Make sure there’s plenty of volume behind the change. Whichever currency pairs you choose to trade, always take liquidity into consideration before setting leverage and stop orders.

Open Exness Demo Account

Open FXTm Demo Account


blog21

Hedging vs Stop Loss

It’s not so hard to find an attractive currency pair to trade after spending an hour or two on your technical and fundamental analysis, but how can you protect your trading account from those unexpected and rapid crashes that happen from time to time?

It’s not so hard to find an attractive currency pair to trade after spending an hour or two on your technical and fundamental analysis, but how can you protect your trading account from those unexpected and rapid crashes that happen from time to time?

If you’ve been using Stop Loss, then there’s a chance that you may have missed a rally or two; as a result you may have ended up losing when you could potentially have seen some significant gains. Read on to discover whether there’s an alternative to Stop Loss that will ensure your orders don’t get closed prematurely, keeping you in with a chance to take full advantage of the next big rally. But first, let’s look at how Stop Loss actually works.

How Stop Loss works

If you’re trading a volatile currency, setting a Stop Loss just seems like the smart thing to do. After all, the forex market never sleeps, and anything can happen while you’re away from your trading platform. Stop Loss is a pending order, that will automatically activate when market conditions reach or match the level you specified, but this type of order has a weak point that many new traders discover the hard way.

Let’s use some simple numbers to explain the problem.

A USDJPY Buy order at 111.300

Take Profit at 111.400

Stop Loss at 111.280

If the price falls to 111.280, your Stop Loss will protect you from losing more money as it will automatically close your order. But what happens if the price bounces back up to 111.300 or above? Huge disappointment! Have you ever gone back to your trading platform to check your order after a few hours, saw that the price was on the rise, but then realised that your order had already been closed by a brief downward spike? Such price moves are often a source of frustration and complaint, especially with volatile pairs or during economic releases. Thankfully, there is an alternative to Stop Loss.

How hedging solves the problem

Consider setting a pending hedging order instead of a Stop Loss. Hedging also offers protection from huge losses, but it won’t close your order. Let’s use the same USDJPY order to see how a pending hedging order performs.

Buy order at 111.300

Take Profit at 111.500

Pending Sell order to activate if the price hits $111.280

If the price falls to $111.280, the hedging order activates. From that point, the hedging Sell order will offset any losses to the original Buy order. Your account will not suffer, no matter how low the price goes. And, your Buyorder is still active if a rally is just around the corner.

When to stop the hedging order

If the price goes down, bounces back, and eventually moves into a rally, then your Buy order will profit as you intended, but your hedging Sell order is losing now, and eating away at your Buy order profit. What can you do?

Consider setting a Stop Loss for your hedging Sell order at the entry point of the original Buy order. This way, when the rally kicks off, the hedging Sell order will be closed and you’ll enjoy all the benefits of the rally. You’ll take a slight loss from your hedging Sell order, but at least your Buy order remains active and ready to reap the rewards of the rally. Some might say a fair tradeoff worthy of the fuss.

Word to the wise

Play around with the Exness demo account to better understand this strategy. Only after you get familiar with the mechanics of hedging should you consider trying it for real. With such protection in place, you’ll be able to use a higher leverage, even if market volatility is rampant.

Using hedging instead of Stop Loss is not a bulletproof solution. If, in the example we used above, the price falls then continues to fall, you cannot profit, and you’ll end up closing both orders with a small loss. Using such trading tools can make a huge difference to your trading performance. The little things make a big difference and often separate the beginners from the professionals.

Open Exness Demo Account

Open FXTm Demo Account


blog28

Do Forex Signals Really Work?

Do Forex Signals Really Work? What We Tell Our Own Clients

If you've spent any time in forex Telegram groups, you've seen the promises: "93% win rate," "200 pips this week," "copy my trades and get rich." As an Exness Introducing Broker working with thousands of traders since 2006, we get asked constantly: do forex signals actually work? Here's the honest answer, based on what we've actually seen play out in our clients' accounts — not marketing talk.

The Short Answer

Some signals work. Most don't — at least not consistently. The signal itself is rarely the deciding factor in whether a trader makes money. What actually determines the outcome is what the trader does around the signal: position sizing, stop-loss discipline, and whether they understand why the signal was given in the first place.

What We've Actually Seen

Over the years, working with active traders on our rebate program, a clear pattern has repeated itself:

  • Traders who blindly copy signals with no risk management tend to blow up their accounts within weeks — even when the signal provider's historical win rate looked good on paper.
  • Traders who use signals as one input alongside their own analysis — checking the reasoning behind a signal, sizing positions conservatively, and using stop-losses — do noticeably better, whether or not the specific signal was "correct."
  • Free signal groups with no verified track record are the riskiest category. If a provider can't show a real, broker-verified trading history (not just screenshots), treat every signal as unverified.

Why Signals Fail Even When They're "Right"

This is the part most articles on this topic skip. A signal can call the market direction correctly and still cost you money, because:

  • Position sizing mismatch: a signal built for a $10,000 account with a 50-pip stop loss can wipe out a $200 account in one trade.
  • Entry timing lag: by the time a signal reaches you (especially in busy Telegram groups), the price may have already moved past a favorable entry.
  • No exit plan: many signals give an entry and take-profit, but no plan for what to do if the market stalls or reverses before either level is hit.

A Better Alternative: Automate Your Own Rules

Instead of relying on someone else's signal, many of the traders we work with have moved toward Expert Advisors (EAs) — automated strategies that follow a fixed, tested set of rules on your own account, with your own risk settings. This removes the guesswork of "is this signal provider trustworthy today?" and replaces it with a system you can actually test and understand. If you're curious about this approach, our Exnessfarsi YouTube channel covers indicator and EA basics for Persian-speaking traders.

How to Evaluate Any Signal Provider (Free or Paid)

  1. Ask for a broker-verified track record (MyFXBook or similar), not just screenshots
  2. Check whether they specify stop-loss and position size, not just entry/target
  3. Test on a demo account first, for at least a month, before risking real funds
  4. Never risk more than 1–2% of your account per signal, regardless of how confident the provider sounds

The Bottom Line

Forex signals aren't a shortcut to consistent profit — they're, at best, one input into a broader trading process that still requires risk management and a clear plan. Whether you use signals, an EA, or your own analysis, the trading costs you pay on every position are real either way. That's exactly why we built our Exness cashback program — so that regardless of how you decide to trade, you get some of that cost back every month.

Want to learn more about reducing your trading costs directly? Check out our About page to see how our rebate program works, or read our full Exness Broker Review.

blog25

How to Use Fibonacci Retracement

In this article, I’m going to show you how to apply Fibonacci retracement levels to a chart and what information it provides. Remember, indicators “indicate” possible price moves and entry-exit points. You’ll still need to interpret the data for yourself, so I’ll show you how to do that too.


What is Fibonacci retracement

Let’s break down the words Fibonacci and retracement to better understand what this tool does.

Fibonacci was an Italian mathematician who discovered a sequence of numbers that occurs in nature. This infinite sequence is created by adding together the preceding two numbers on the list to create the next number. For example: 0, 1, 1, 2, 3, 5, 8, 13, 21, etc.

Retracement refers to how a price trend can sometimes temporarily fall back before continuing in the direction of the trend.

Why is Fibonacci retracing so useful?

The Fibonacci Retracement tool helps traders identify levels for setting Buy Stop Limits or Sell Stop Limits that can activate orders whenever a price retracement occurs. The indicator lines also help when searching for a trading entry point level on a trending price move.

How to set up Fibonacci levels

Open your Exness demo account and let’s apply the Fibonacci tool to a chart. EURGBP often displays volatility. It’s a perfect pair to demonstrate how the Fibonacci tool can help you set a more profitable order prior to a price retracement. On the top menu of your trading platform, set the timeframe to H4 (4 hourly) and display the price as a line.

Go to the top menu >> Insert >> Fibonacci >> Retracement

On the chart, draw a line at the start of a trend to the point of reversal by holding down the left mouse button until you get to the break.

If a retracement occurs, how low will it go? That’s where the yellow lines or levels can help with your forecasting. The displayed Fibonacci levels or lines offer several entry points. Assuming the trend continues, the higher the line value the greater the profit. These entry points levels can be customized, but most traders don’t mess with the defaults. So which level should you choose for your entry point?

Fibonacci retracement entry points

In the example above, EURNZD started a bull run at 4:00 pm on March 26. A retracement began four hours later. The Fibonacci tool displays six levels ranging from 0.0 (no retracement) to 100.0 (full reversal). Choosing the right level is ultimately your decision, but the Fibonacci levels work as an effective guideline or benchmark. Just remember that an indicator is not a time machine and market prices don’t always follow the mathematical rules.

23.6: A small move that happens all the time and offers limited value or improved profitability.

38.2: An accurate forecast at this level creates attractive profits, and the likelihood of it occurring remains quite high.

50.0: Half retracement. Not a tall order by any means, but the improvement to your profit ratio improves significantly—compared to opening a position on the high.

61.8: Entering the realm of more and more unlikely. To catch such a reversal in the middle of a rally is a long shot, but highly profitable when it happens.

Most conservative traders will probably set entry levels between 23.6 and 50.0 but that number will rise as your knowledge and experience grows.

In the example above, the reversal dropped to the 38.2 mark and then continued to rally well beyond the price at the time of drawing the Fibonacci lines.

Top Fibonacci trading tip

Remember, market prices won’t always fit in with Fibonacci levels so perfectly. Many unexpected changes can and will affect your orders if you trade on a daily basis. Most traders agree that the longer the timeframe and greater the price difference, the more accurate the forecast.

Trading indicator tools can be likened to comments on Amazon. You’ll get better results in the long-term if you take more than one into consideration, so work hard and use other indicators together with fundamental analysis.

Test the Fibonacci trading tool on a real or demo account


Open Exness Demo Account

Open Alpari Demo Account


The Breakout Strategy

The Breakout Str

News Release Trading Strategy

News traders trade off economic news release. The Forex market is particularly reactive to economic news, in particular, interest rate news from the G8 countries, as well as unemployment news for each corresponding country. News traders will have to bear in mind that the Forex market movements have already taken in to consideration existing and expected economic news. The sharp movements you see due to economic news are corrections due to unexpected news, either better than expected or worse than expected.

Another consideration to take to heart for potential news traders is that during negative sentiment news reports, currency movements generally head towards lower yielding and perceived safer currencies; USD and JPY in particular.

A good grasp of economics is generally recommended for traders wishing to start news releasing trading.

An economic news calendar is highly recommended. Forex Economic calendars show the release date for important economic news such as non-farm payroll, GDP figures and interest rate news. Below is an example of what an economic calendar shows:

ategy is the break out of a sideways trend. Usually, momentum is greatest on breakout points. A lot of traders take advantage of the breakout strategy when sideways moving prices break the upper or lower limits. Below represents a few breakouts following some periods of sideways tending.

Combine Fibonacci retracement with the Exness cashback rebate program to maximize your profits on every trade.


Ready to apply Fibonacci retracement in live markets? Open your free Exness account today and start trading with one of the world’s most trusted forex brokers.


👉 Open Your Exness Account: https://www.exness.direct/a/t1e8k1e8


Frequently Asked Questions (FAQ)

What is Fibonacci retracement in forex?

Fibonacci retracement is a technical analysis tool that uses horizontal lines to indicate potential support and resistance levels based on Fibonacci ratios (23.6%, 38.2%, 50%, 61.8%, and 78.6%) before the price continues in the original direction.

Which Fibonacci level is most important?

The 61.8% level, also known as the “golden ratio,” is considered the most important Fibonacci retracement level. Many traders watch this level closely as it often acts as a strong support or resistance zone.

How do I draw Fibonacci retracement levels?

To draw Fibonacci retracement levels, identify a significant swing high and swing low on your chart. In an uptrend, draw from the swing low to the swing high. In a downtrend, draw from the swing high to the swing low. Most trading platforms including MT4 and MT5 have a built-in Fibonacci tool.

Does Fibonacci retracement work in forex?

Yes, Fibonacci retracement is widely used and respected in forex trading. However, it works best when combined with other indicators such as RSI or moving averages to confirm signals before entering a trade.

What timeframe is best for Fibonacci retracement?

Fibonacci retracement works on all timeframes, but is most reliable on higher timeframes such as H4, Daily, and Weekly charts where support and resistance levels are stronger and more significant.