blog30

Stochastic: What’s it Really Showing You?

Ever heard the expression “getting ahead of the curve?” In trading, this cliche perfectly reflects what every trader wishes they could consistently do. In addition to fundamental analysis, you might turn to charts to forecast price moves. A big part of using charts to make sense of the markets are indicators, but are they really any good? Many traders turn to the Stochastic indicator to check overbought or oversold levels, so just what insights does Stochastic analysis really offer, and how can you use these insights to determine when to open a position?


Here’s an overview of this popular indicator, why you might be struggling to use it, and some top tips that will help you avoid misinterpreting market moves.

Get free access to our trading platform and hundreds of indicators

Overbought and oversold

The terms overbought and oversold describe a period where there has been significant movement in price without much pullback or reversion. Simply put, a rise or fall that doesn’t deviate far from the trend line.

What goes up…! You know the saying. Price trends can’t last forever. They eventually reverse, and trading close to that point of reversal is one way you can maximize your profits. In traditional technical analysis, traders expect overbought or oversold currency pairs to reverse, but that’s not always the case and it can be quite an expensive realization. To constantly set your trades based on the Stochastic indicator will yield mixed and likely disappointing results.

How to read the Stochastic

If you’ve already signed up with Exness, then you have access to a trading platform and a risk-free demo account. This is the perfect way to get familiar with any of the free and paid indicators available. Open up your platform and go to the Navigator pane on the left. Scroll down and then drag the Stochastic folder to the chart. A section will appear below the price chart with two lines tracing along, above, and below a central range.

The concept is fairly simple. The lower horizontal line represents a value of 20. The upper horizontal line is 80. Whenever the tracing line breaches 80, it indicates a possible overbought status, and traders expect a price correction. Likewise, if the lines cross below the 20-mark, it signals a possible oversold status, and a reversal might be imminent.

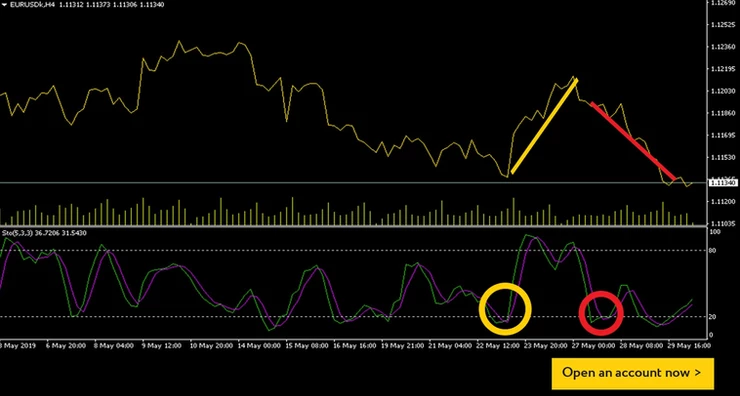
In the above EURUSD example, a downtrend started on May 19 and crossed the 20-line on May 22 [yellow]. Traders using the Stochastic indicator would normally take this as a sign of overbought, and they would set a buy order with the expectations of a reversal. They would consequently be very pleased with the rise that followed. Just five days later, Stochastic indicated another oversold status [blue], but traders clicking the buy buttonprobably lost whatever profits they’d achieved the previous week. So, what’s going on?

Indicators are not fortune-tellers

FX News does not recommend using the Stochastic indicator as a stand-alone forecasting strategy. Indicators are best used to confirm theories, not to create them. Having said that, Stochastic is one of the best indicators a trader can use, but you might consider adding a little common sense to the mix. In the yellow example above, you can see that the price line and the Stochastic lines match rather well in the days preceding the oversold signal—and continue to do so after the fact. The perfect example of how a Stochastic indicator can forecast a reversal!

The blue example a few days later shows a clear divergence. The Stochastic line falls dramatically in a complete reversal from overbought to oversold, but the price line barely moves in comparison. Consider that a warning sign! Another common indicator is that the reversal usually comes when the rise or fall happens in a short period of time. Watch out for steep peaks and valleys that accompany the overbought/oversold range.

Top trading tips for advanced traders

Although we’ve used a price line to better illustrate the price moves in the chart image, FX News suggests using candlesticks when performing chart analysis. Moreover, Stochastic’s default %K period and slowing is set at 5,3,3, but cautious traders usually use higher numbers. On the top menu, go to Insert > Indicators > Oscillators > Stochastic Oscillator and set to 15,5,5. You can run both settings at the same time to see the differences. Certain settings may work better for certain pairs, so play around with the levels before committing to one.


Test Stochastic on your Exness trading platform

Open Exness Demo Account

Open Tickmill Demo Account

Open FXTm Demo Account

blog27

Your Trading Platform: Balance, Equity, Free Margin and More

As a new trader, have you ever felt a little overwhelmed by your trading platform? Like with most software suites, the first encounter can seem confusing and even demotivating, but don’t worry. When it comes to learning how to use all the trading tools available on your platform, you can master them in a relatively short time just by experimenting with your Exness demo account. However, there are five terms in the lower window of your trading platform that need a little more explanation as they often cause a little confusion for the average newbie.

After you’ve read this article, open up your trading platform and see how these figures interact with your orders and each other. Understanding the numbers and calculations you see on your platform will definitely give you confidence and even help you to place trades that better suit your trading budget.

What the trading platform doesn’t show you

Before we can get to those all-important amounts displayed on the lower section of your trading platform, we need to understand one figure that you can’t see when setting orders. Leverage! Your leverage setting depends on which account you are using. Exness allows you to have multiple trading accounts in a single personal area. This is so you can customize your trading conditions to match the currencies you are targeting.

It’s very hard to target serious profits if you only have limited funds to trade with. For example, if you have $100 in your account, the maximum market position you can have is $100, which won’t generate much profit—unless you catch the beginning of a huge price increase. Exness solved this problem by offering a wide range of leverage options. This way, a trader who funded their account with $100 and has a l:100 leverage setting can effectively open a $10,000 order. Higher leverage means your orders are sensitive to even the smallest changes in market prices, which can create attractive profits, but it can also cause rapid and significant losses. Consider which leverage is right for you very carefully. Now you know about leverage, let’s see how it applies to the amounts shown near the bottom of your trading platform.

Balance

Your account balance is the easiest of the five figures to understand. It is simply the amount of money in your account, without taking into consideration the profits and losses of your current open orders. This number only changes when you deposit, withdraw, or close a trade. It does not react to the second-by-second price shifts.

Equity: (margin + free margin) and/or (balance +/- profit/loss)

Equity is the sum of your balance and your open orders. It shows the amount of funds that you will have if you close all open orders at that moment. Take a look at your balance, then add or subtract the total result of your open orders. That’s equity.

Margin: (Lot x contract size / leverage)

Fore margin is a portion of your trading funds that becomes frozen or temporarily inaccessible whenever you set orders on your trading platform. Trading margin is calculated based on the size of your open orders divided by your leverage setting.

The margin amount shown on your trading platform is not a fee. Think of it like a car rental security deposit. If nothing goes wrong for the duration of your contract, then you get your money back. Likewise with trading, if you choose the right price direction or close the order at the first sign of danger, your margin will remain untouched.

Free margin: (equity – margin)

How much money is available in your trading account for opening more orders? Free margin shows the amount of usable funds and changes as your profits or losses change. The level of free margin on display should always influence how large your orders can be. Keep in mind that the higher the leverage, the lower the margin required for each order.

Margin level (equity / margin) x 100)%

This is a number you should watch to avoid getting stopped out. Stop out is the level at which your broker will start closing your losing positions. So long as your margin level stays above 100%, you’re in control. If, however, you trade with an ECN account and your margin falls to 50%, some of your positions will be closed automatically.

6 key points to remember

Set your leverage based on how volatile your targeted trading pairs are. The larger the volume and liquidity, the higher you can set leverage.Your balance and deposits should reflect your current financial circumstances. Don’t overextend your lifestyle or bank account to trade at a higher level. Follow a risk management strategy and start low and slow.If your trading strategy requires you to raise your account balance on a daily basis, equity will show you when it’s time to close your orders and call it a day.Whenever a trade turn negative, margin will act as a benchmark for the broker to send you a margin call. Note: Margin call is a notification informing you to add funds or close your orders before your funds are depleted).If you are a more conservative investor, try and keep your free margin equal to around 80% of your equity. Overextending your trading activities to the point where a loss could wipe out your funds is a common rookie mistake. A Stop Loss or pending hedging order can ensure that rule remains unbroken, even when you are not monitoring your trades.If your margin level drops close to 100%, consider closing the open orders that seem to have the least potential.

Write what’s right

Remembering all these terms can be tricky, so be sure to put these observations in your trading journal. Take notes on how these tips affect your trading performance. With every learning opportunity, you are one step closer to becoming a professional trader. Set aside some time to explore your trading platform, and expand your trading budget as your experience and confidence increases.

Open Exness Demo Account

Open Tickmill Demo Account

Open FXTm Demo Account
blog26

A Trader’s Guide to Closing Orders

This article is dedicated to those of you who already have a trading account but haven’t managed to establish a trading routine yet. There’s so much to learn, and it can sometimes feel overwhelming. There are tutorials that show you how to use the trading platforms, and economic news releases that can help you find a currency pair to trade. What’s hard to find is an explanation of how high you should set your profit goals. Even more elusive is a clear rule for how long you should keep your orders open. Here’s a simple strategy for setting your exit points based on price history instead of profits or losses.

Stopping orders at the right time

If you’ve built your trading confidence on the Exness demo account, then you’ve probably seen some sizable profits and losses. Keep in mind that your trading goal is not to be consistently profitable—that’s not a realistic option. Keeping the total profits above the total losses is something full-time traders usually aim for, and there are many techniques that can help with that. Of course, that’s easier said than done, but there are some areas that more inexperienced traders often overlook. Let’s say, you’ve got an open order on your trading platform. You’re hopefully thinking of setting your Stop Loss and Take Profit levels, but what you might not be sure about is the exit points. This is where the chart timeframes can help. Firstly, just how long are you planning to keep your orders open? It’s the first thing to consider. If you place an EURUSD order for the day, your Take Profit and Stop Loss setting could be very different from an intended month-long order. Here’s why.

Timeframe analysis

Timeframe analysis is primarily used for trend trading. For example, if you are thinking of trading XAUUSD, you might consider sticking to longer timeframes for analysis and speculation. This is because gold has a slow and slightly more predictable rise over the course of each year. It is considered by many traders as a long-term investment option. When you set your exit points, set your timeframe to show the big picture. If you plan to close the order in a month, what were the prices one month ago? Apply this logic to all your trades, then compare the historic price level with the current level of resistance.  In contrast, if you are day trading, don’t expect the prices to go far beyond what you’ve seen over the last 24-hours. Whatever levels prices reached last year shouldn’t influence your short-term orders.

Top trading tip

Ideally, you are looking for trends that are consistent on multiple timeframes. If, for example, both short-term and long-term trends have bullish indicators, a Buy order could be a strong option. If the short-term trend shows bearish tendencies within a long-term uptrend, caution is advised.

Reading price charts is not something that can be learned in a day. Like driving a car, you need to spend time practicing before you take to the highway. Make time to check the timeframes of multiple currency pairs each day. Look at the time period you intend to trade and take detailed notes on price history. How much movement occurred over how much time? Make conclusions and write down why you think a Buy or Sell order is favorable, then go back to previous conclusions and see if you were right or wrong.

As you learn from your mistakes, your perceptions of the market’s ebb and flow will change. Remember, the goal of this strategy is to have more profits than losses. You’ll never win them all, but there’s always room for improvement.

Test and develop your analytical skills risk-free on a demo account

Open Exness Demo Account

Open Alpari Demo Account

Open Errante Demo Account

blog24

Trading Strategies An introduction to the most popular strategies and how to choose the best one for

Trading Strategies

Having placed some random trades, you would have figured out that when you place an order to buy or sell, you could potentially earn or lose money. The theory is quite simple, pick the right direction and you will make money. The important question is how do I pick the right direction?

Strategies are a systematic and planned course of action based on existing information you know of the market. There are a multitude of strategies for Forex trading. A lot are available to learn for free by doing an Internet search, books available and people that will teach these strategies for a fee. Around the world, professional traders and recreational traders alike will always hold at least one trading strategy to heart and will attribute their success in trading to following that one or many trading strategies. The following section covers some popular strategies that are used by many traders.

The Trending Strategy

The trending strategy is to follow the market in the direction that it is clearly following over an extended period of time. Currency pairs often take either bullish (up) or bearish (down) trend.

By following the trend of a particular currency pair, you are banking on the fact that the currency continues its existing direction and you are taking in a profit by following the market direction. This strategy is by far the most popular strategy method for trading currency.

Trends can be long or they can be short, meaning that there are short-term trends and there are long-term trends. An example would be that during a 6-month period, there was a bullish trend for the AUD/USD, however, in between this 6-month period there were 2 short periods where it took a bearish trend. The following is a graphical representation of the example.To apply strategies effectively, you first need to read charts correctly — see our guide on Reading Forex Charts Like a Pro.

If you held a buy position from the start of the 6 months to the end, you would be well in profit. Be careful when you look for your trends. Sometimes when you look at a chart and it shows a very clear trend, if you were to expand your chart to include more data it could very well show you the opposite. As such, if you are looking for trends make sure you view the time frames of all charts.

The Ranging Strategy

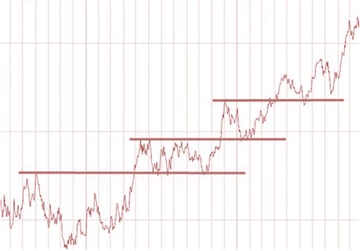
The Ranging Strategy occurs when a currency is trading between a set upper and lower limit and seems to constantly bounce up and down between the high and low limit. Traders take the opportunity to sell when it is at the upper limit and to buy when it is at the lower limit. Represented in the image below, you will see a sideway trend. This marks the opportunity for people who follow a ranging strategy.

The Breakout Strategy

The Breakout Strategy is the break out of a sideways trend. Usually, momentum is greatest on breakout points. A lot of traders take advantage of the breakout strategy when sideways moving prices break the upper or lower limits. Below represents a few breakouts following some periods of sideways tending.

The Breakout Strategy

The Breakout Str

News Release Trading Strategy

News traders trade off economic news release. The Forex market is particularly reactive to economic news, in particular, interest rate news from the G8 countries, as well as unemployment news for each corresponding country. News traders will have to bear in mind that the Forex market movements have already taken in to consideration existing and expected economic news. The sharp movements you see due to economic news are corrections due to unexpected news, either better than expected or worse than expected.

Another consideration to take to heart for potential news traders is that during negative sentiment news reports, currency movements generally head towards lower yielding and perceived safer currencies; USD and JPY in particular.

A good grasp of economics is generally recommended for traders wishing to start news releasing trading.

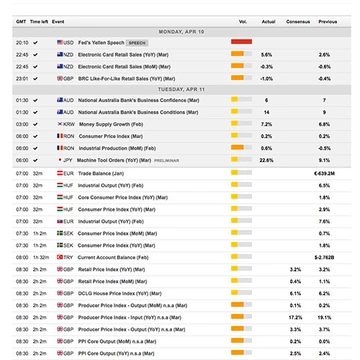
An economic news calendar is highly recommended. Forex Economic calendars show the release date for important economic news such as non-farm payroll, GDP figures and interest rate news. Below is an example of what an economic calendar shows:

ategy is the break out of a sideways trend. Usually, momentum is greatest on breakout points. A lot of traders take advantage of the breakout strategy when sideways moving prices break the upper or lower limits. Below represents a few breakouts following some periods of sideways tending.Before trading live, make sure you have a solid Forex Trading Plan — discipline is what separates profitable traders from the rest.

Open Exness Demo Account

Q: What is the best forex trading strategy for beginners? Trend following is the best starting strategy for beginners. It involves identifying the direction of the market using moving averages and trading in that direction. It is simple, logical, and works across all timeframes and currency pairs.

Q: What is the difference between scalping and swing trading? Scalping involves opening and closing trades within minutes to capture small price movements and requires constant attention. Swing trading holds positions for days or weeks to capture larger moves and suits traders who cannot monitor charts all day.

Q: How many strategies should I learn at once? Focus on one strategy at a time. Master it on a demo account before moving to live trading. Jumping between strategies is one of the most common reasons new traders fail.

Q: Do forex trading strategies work in all market conditions? No. Trend-following strategies work best in trending markets, while range trading strategies perform better in sideways markets. Learning to identify market conditions is as important as the strategy itself.

Q: How long does it take to master a forex trading strategy? Most traders need at least 3 to 6 months of consistent practice on a demo account before a strategy becomes second nature. Rushing this process often leads to losses on a live account.

Q: Where can I test forex strategies without risking real money? Use a free Exness demo account to test any strategy with virtual funds and real market conditions. Open your free Exness demo account here.