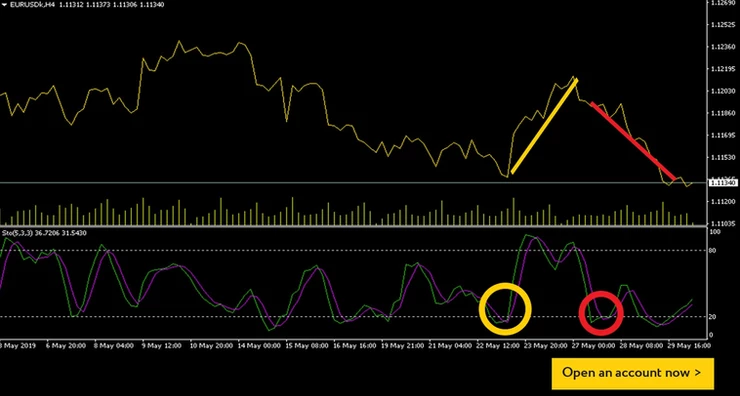
In the above EURUSD example, a downtrend started on May 19 and crossed the 20-line on May 22 [yellow]. Traders using the Stochastic indicator would normally take this as a sign of overbought, and they would set a buy order with the expectations of a reversal. They would consequently be very pleased with the rise that followed. Just five days later, Stochastic indicated another oversold status [blue], but traders clicking the buy buttonprobably lost whatever profits they’d achieved the previous week. So, what’s going on?
Indicators are not fortune-tellers
FX News does not recommend using the Stochastic indicator as a stand-alone forecasting strategy. Indicators are best used to confirm theories, not to create them. Having said that, Stochastic is one of the best indicators a trader can use, but you might consider adding a little common sense to the mix. In the yellow example above, you can see that the price line and the Stochastic lines match rather well in the days preceding the oversold signal—and continue to do so after the fact. The perfect example of how a Stochastic indicator can forecast a reversal!
The blue example a few days later shows a clear divergence. The Stochastic line falls dramatically in a complete reversal from overbought to oversold, but the price line barely moves in comparison. Consider that a warning sign! Another common indicator is that the reversal usually comes when the rise or fall happens in a short period of time. Watch out for steep peaks and valleys that accompany the overbought/oversold range.
Top trading tips for advanced traders
Although we’ve used a price line to better illustrate the price moves in the chart image, FX News suggests using candlesticks when performing chart analysis. Moreover, Stochastic’s default %K period and slowing is set at 5,3,3, but cautious traders usually use higher numbers. On the top menu, go to Insert > Indicators > Oscillators > Stochastic Oscillator and set to 15,5,5. You can run both settings at the same time to see the differences. Certain settings may work better for certain pairs, so play around with the levels before committing to one.
Test Stochastic on your Exness trading platform
Open Exness Demo Account
Open Tickmill Demo Account
Open FXTm Demo Account


不知道说啥,开心快乐每一天吧!
Thank you
your welcome/
If you like rebate till %60 you can signup in exness broker if this link
https://goldenrebate.com/largestbroker