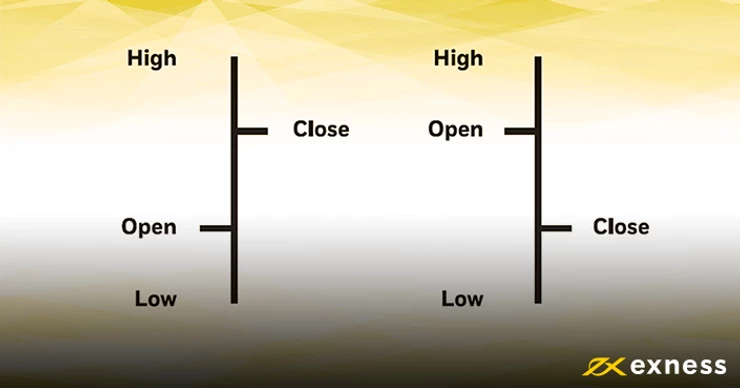
Just remember that the highs and lows never change, but the opening price on a candlestick switches place whenever the price direction changes. A rising trend opens on the bottom. A declining trend opens on the top. Candlesticks take a little getting used to, but when you do, there are dozens of patterns to watch out for that have a history of indicating rally moves or crashes.Chart reading becomes more powerful when combined with a strategy — explore Popular Forex Trading Strategies to put your skills into practice.
So which forex chart is better for forecasting?
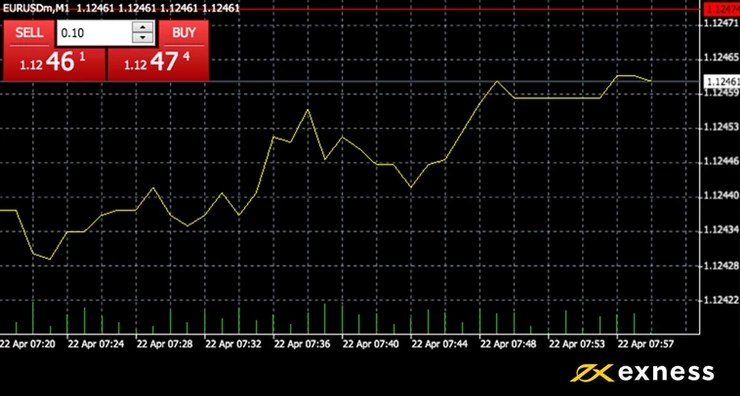
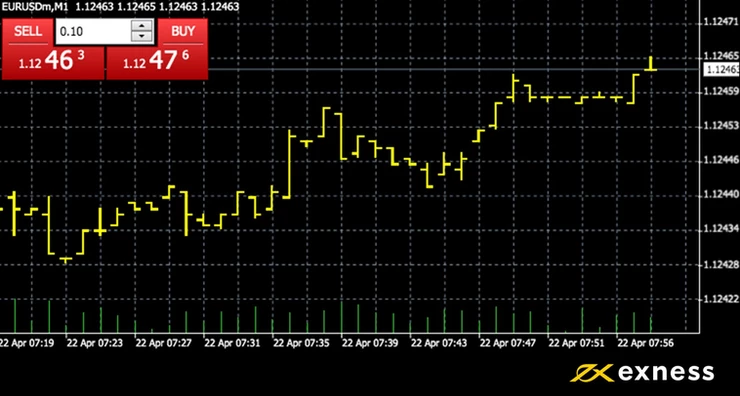
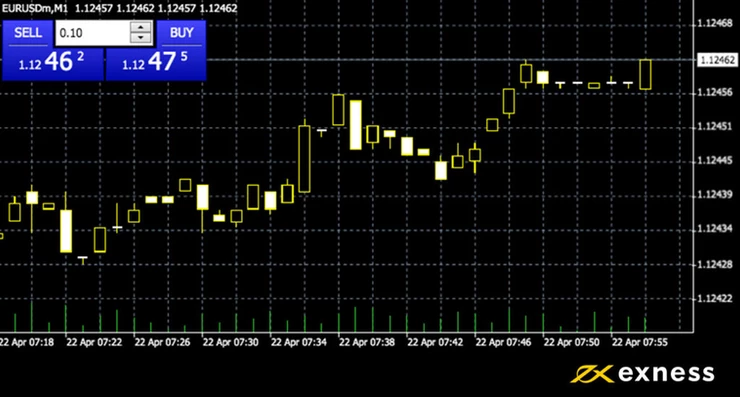
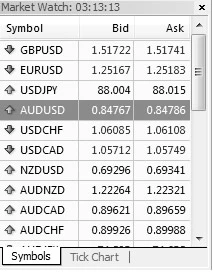
Take a look at the three forex chart screenshots in this article. Which one seems the easiest to read or analyze? It’s really down to your own personal preference. Lines are great for a quick and easy overview, but they show much less when you’re looking at a one-minute timeframe. Consider using lines for long-term trading analysis or quick checks on how a fundamental release is affecting market prices. If you tend to open and close orders in the same day, candlesticks might be a better choice.Ready to apply what you’ve learned? Open a free Exness demo account and start practicing chart analysis with zero risk.
Test your analytical eye on the foreign exchange market
Open Exness Demo Account
Frequently Asked Questions
Q: What is the best chart type for forex trading beginners?
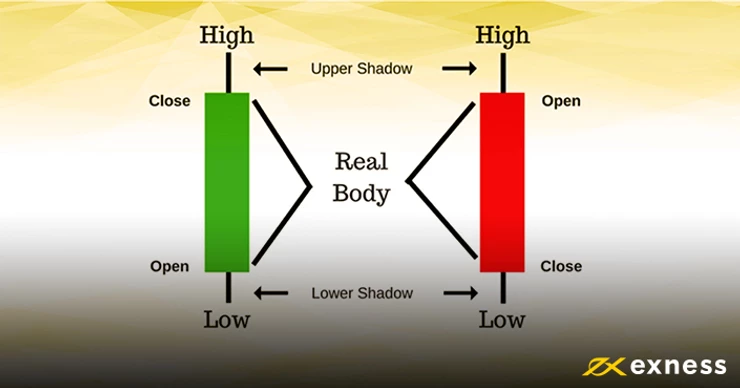
Candlestick charts are the best starting point for beginners. They show open, close, high, and low prices for each period and make it easy to spot patterns and market sentiment at a glance.
Q: What is the difference between a bar chart and a candlestick chart?
Both show the same price data (open, high, low, close), but candlestick charts use colored bodies that make it much easier to quickly identify bullish or bearish candles. Most professional traders prefer candlestick charts.
Q: Which timeframe should I use when reading forex charts?
It depends on your trading style. Day traders typically use 5-minute to 1-hour charts. Swing traders prefer 4-hour or daily charts. Always check the higher timeframe first to understand the overall trend before going to a lower timeframe for entries.
Q: How do I identify a trend on a forex chart?
An uptrend consists of higher highs and higher lows. A downtrend consists of lower highs and lower lows. Use the daily chart to identify the main trend before looking for entry signals on smaller timeframes.
Q: What indicators should I add to my forex chart?
Start simple — a 50 EMA and 200 EMA for trend direction, and RSI for momentum. Avoid overloading your chart with too many indicators as this leads to confusion and conflicting signals.
Q: Where can I practice reading forex charts for free?
Open a free demo account on Exness and use MT4 or MT5 to practice reading charts with real market data and no financial risk. Open your free Exness demo account here.
Tags:
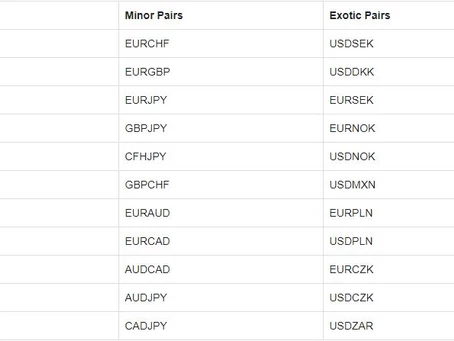
AUD, Brexit, Brexit, Banks, CAD, CHF, CNH. currency hedging, CZK, Donald Trump, EU EUR, forex trading, GBP, Global, Growth, Fears, Gold Prices, Government Shutdown, HKD, Is forex trading profitable, JPY Leverage, Mean Reversion, MXN, NOK, NZD, Passive income, popular strategies, Risk Management, RUB, Safe, haven currencies, second referendum, SEK SGD, Silver, Price, technical indicators, trading account, Trading Basics, trading psychology, Trailing Stop, trump wall, TRY USD, USD Price, Chart, XAG, XAU, ZAR, indicator, Forex Millennium, Karl , golden rebate, rebate, cashback,