blog16

Want To Trade Forex Like An Expert? Control Your Environment

Why  Building A Supportive Forex Trading Environment Is Important

What do I mean by supportive trading environment? I mean that no one exists in a vacuum. Many things outside the actual forex market itself — from the physical environment you trade in to your personal circumstances at the time you are trading — can impact your trading performance. Maybe you have skeptical family members that are giving you a bad case of performance anxiety. Maybe you don’t have enough funds in reserve, which causes adverse anxiety and pressure that impacts your performance. Whatever the reason may be, the outside world impacts your performance just as much as market conditions.

Top Tip: The Outside World Matters

Knowing what outside factors impact your trading performance — and setting up your environment to support your best performance — can be a good way to improve your trading.


Open Exness Demo Account

Open FXTm Demo Account


Tags:

AUD, Brexit, Brexit, Banks, CAD, CHF, CNH. currency hedging, CZK, Donald Trump, EU EUR, forex trading, GBP, Global, Growth, Fears, Gold Prices, Government Shutdown, HKD, Is forex trading profitable, JPY Leverage, Mean Reversion, MXN, NOK, NZD, Passive income, popular strategies, Risk Management, RUB, Safe, haven currencies, second referendum, SEK SGD, Silver, Price, technical indicators, trading account, Trading Basics, trading psychology, Trailing Stop, trump wall, TRY USD, USD Price, Chart, XAG, XAU, ZAR,


blog11

3 More Economic Indicators You Need To Know

Forex indicators are crucial tools that can be used by all traders in order to improve to become more effective at what they do.

1. Bollinger Bands/Envelopes

Bollinger bands, also known as envelopes, were developed in the 1980s by John Bollinger to measure whether prices were high or low in relation to market volatility. Most traders use Bollinger bands to determine whether trend reversals are about to occur based on market volatility. Bollinger bands are made up of three bands with the middle band being the 20-period simple moving average of the currency pair. The values of the upper and lower bands are derived from the middle band (the upper band is calculated by adding two standard deviations from the middle while the lower band is calculated by subtracting two deviations from the middle). As a trader, you should stick to using the default values of the Bollinger bands as this is what most traders are using. Remember the price of a currency pair rarely strays far out of the Bollinger bands, which is why they are known as envelopes.

One of the most effective Bollinger bands trading strategies is the snapback to the middle band strategy, which is based on the fact that prices typically snap back to the middle band before heading in a specific direction.

2. The MACD Indicator

The term MACD indicator is an acronym for Moving Average Convergence Divergence indicator, which is a trend-following indicator used to measure momentum. Most traders use the MACD indicator to identify trend direction and to determine momentum and potential trend reversals The MACD indicator consists of the MACD line, the signal line and the MACD histogram. The MACD line and signal line move together although the MACD line is slightly faster than the signal line. As a trader, you can use the MACD indicator to generate trade signals, or to confirm trade signals generated by other trading strategies.

3. The ADX Indicator

The average directional index (ADX) indicator is used by most traders to identify whether a currency pair is trending or not. The ADX indicator was developed and introduced into the markets by J. Welles Wilder in 1978. The ADX indicator is used by forex traders to measure the strength of a trend, to identify trends and ranges, and as a filter for different trading strategies.

The ADX indicator is made up of the ADX line, the positive directional indicator (+DI) line and the negative directional indicator (-DI) line. The ADX indicator is calibrated from 0 to 100 with values above 25 indicating a strong trend while values below 25 identify ranging markets. You can also use the ADX indicator to confirm trades from other strategies as well as its own trade signals.

Conclusion

Tools like the Bollinger bands, MACD, and ADX can help you become a more effective trader and to make better trading decisions. While it is important to note that no indicator works all the time and to always apply proper risk management, learning about these three indicators is worth any new trader’s time.

Open Exness Demo Account

Open Hotforex Demo

Open FXTm Demo Account


blog8

Quasimodo Pattern (Over and Under)

Quasimodo Pattern (Over and Under)

TABLE OF CONTENTS:

Easy guide to trading the Quasimodo Pattern

What is the Quasimodo (Over and Under) Pattern?

Conclusion:

Easy guide to trading the Quasimodo Pattern

The Quasimodo Pattern or Over and Under pattern is a relatively new entrant to the field of technical analysis in the financial markets. Although new, the Quasimodo pattern is a commonly occurring theme that is more frequent when price carves a top or a bottom or when price begins a major correction to the trend.The Quasimodo Pattern, although complex as it might seem is actually very simple. This trading pattern is especially powerful because when it occurs, in most cases, traders will notice a confluence with other methods of analysis.For example, when a trader spots a Quasimodo pattern near a support or resistance level, it increases the confidence of the trader or the trading probability. Likewise, when trading divergences, when you spot a Quasimodo pattern, that confluence can be used to trade the divergence set up with more confidence.As we can see from the above, the Quasimodo pattern is not a trading strategy by itself but is more of a confluence pattern that can be used to confirm a trader’s bias. Of course, the Quasimodo pattern doesn’t appear all the time, but when it does, traders can be sure that the market offers a high probability trade set up.

What is the Quasimodo (Over and Under) Pattern?

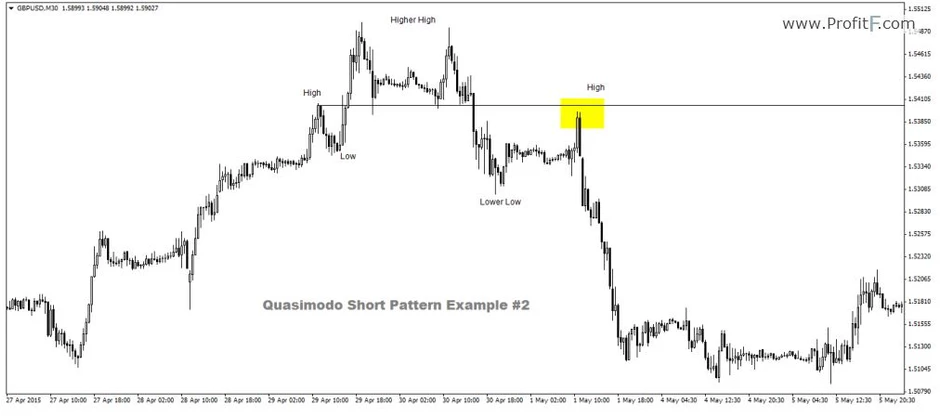
A Quasimodo Pattern is simply a series of Highs/Lows and Higher or Lower highs or lows.

Quasimodo Short Signal Pattern

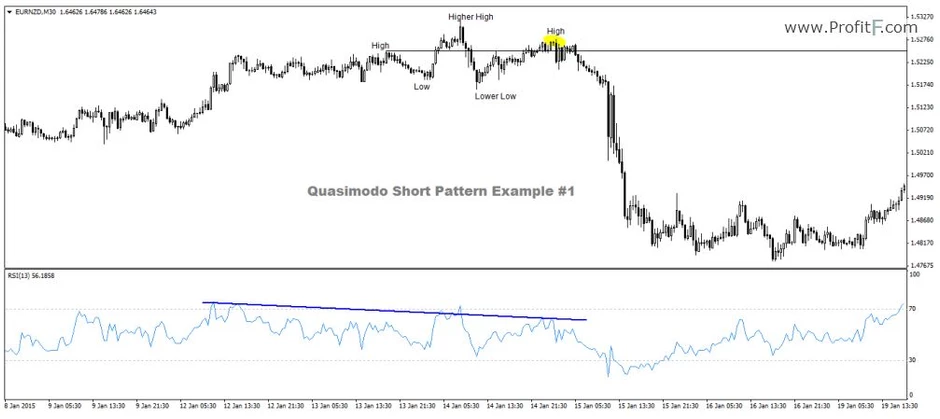
There should be a prior uptrend in the marketsPrice makes a new high, declines and makes a new local lowPrice then rallies above the previous high to mark a new higher highPrice then falls to form a new lower lowPrice then rises towards the initial high (but does not make a new higher high).

The fifth level in the set up is the trigger, where a short position is taken. Stops are set above the higher high and the take profit level is up to the trader.

Quasimodo Long Signal Pattern

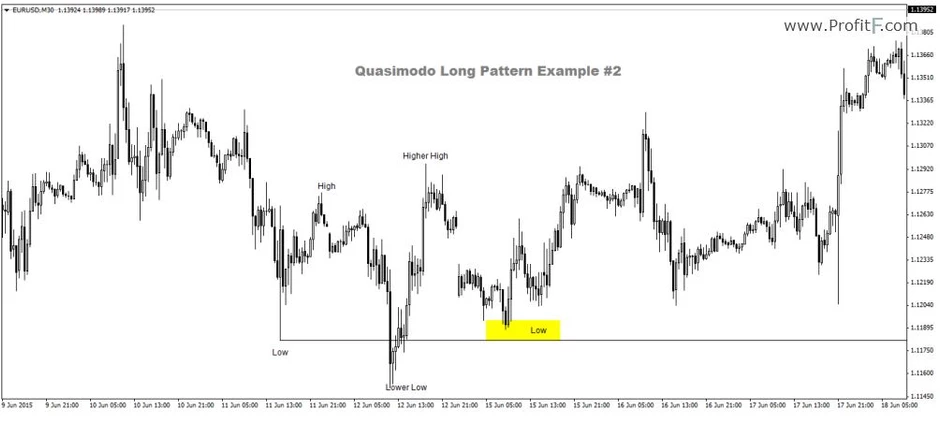
There should be a prior downtrend in the marketsPrice makes new low then makes a small rally and forms a local highPrice then declines to form a new lower low taking out the previous lowPrice then rallies to make a new higher high and then declinesThe final decline is equal to the first low

The fifth leg in this pattern is the trigger for long positions with stops set to at or below the lower low

Quasimodo Long Signal Pattern Examples:

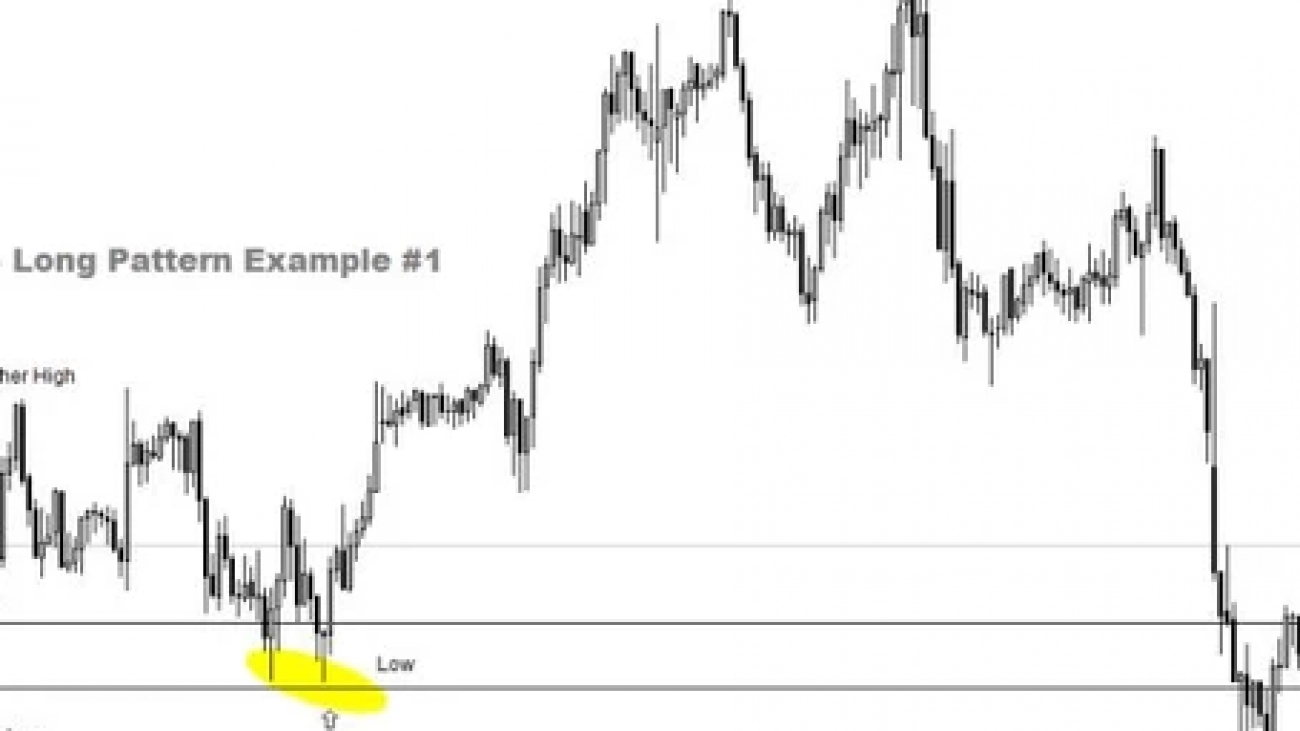
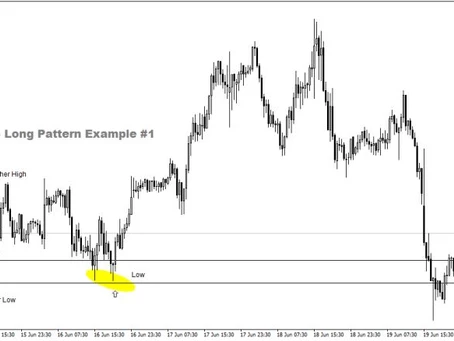
Quasimodo Long Example #1

Price is in a downtrendPrice then makes a new low at 99.923 and then makes a new local high at 100.274Price then declines and makes a new lower low at 99.983Price then rallies to make a new higher high at 100.38 and then declinesThe final leg in the decline is just a few pips above the previous low. This triggers a long signal

Here is another example of the Quasimodo Long example:

Quasimodo Long Example #2 Quasimodo Short Signal Pattern Examples:

Quasimodo Short Example #1

Price is in an uptrendPrice then makes a new high at 1.5251 and then declines to make a low at 1.5187Price then rallies to make a higher high at 1.5321 and then declinesA new lower low is posted at 1.5165Price then makes a modest rally and this high stalls a few pips close to/above the previous highA short entry is then taken with stops near the highest highThere is also an additional confirmation yet again with the RSI divergence as well

Another example of the Quasimodo Short pattern example is given below:

Quasimodo Short Example #2

Conclusion:

As we can see from the above, the Quasimodo or Over and Under pattern is a relatively simple pattern, which when used in conjunction with other trading strategies or signals offers a great way to increase the probability of a trade set up.
Open an Demo Account and test this pattern.

blog6

How To Use The RSI Indicator In Forex Trading

Author:Exness Broker

The relative strength index (RSI) indicator is a technical indicator that is widely used by traders to identify oversold and overbought conditions within charts. The RSI is an oscillator type of indicator that moves up and down a scale from 0 to 100 depending on market conditions. The RSI is regarded as a leading indicator, which means that it can be used to predict future price movements in a financial instrument such as a currency pair. The RSI indicator was developed by J. Welles Wilder and introduced into the markets in 1978.

Understanding The RSI’s Signals The RSI indicator is usually presented as a horizontal chart attached to the bottom of a currency pair’ chart that features a single line that oscillates between 0 and 100.When the RSI is ranging from 0-30, this generally indicates oversold market conditions with a high probability of an upward correction in price. Whenever the RSI is ranging from 30-70, this is generally regarded as neutral territory (neither overbought or oversold). An RSI reading of 70-100 generally indicates an overbought market with a high likelihood of a price correction to the downside. When the RSI crosses from below the centerline (50 level) to the area above, this usually indicates a rising price trend in the affected currency pair. When the RSI cross from above the centerline to the area below it, this usually indicates a falling price trend in the affected currency pair.

RSI Divergence Signals The Relative Strength Index indicator might also show divergence in certain situations where the RSI line trends in the opposite direction to the prevailing price action in a currency pair. This is referred to as divergence, which can either be bullish or bearish, and indicates that a price reversal might be developing.

Bullish RSI Divergence Bullish RSI divergence typically occurs whenever the price of a currency pair is declining and the RSI line is rising, which is a strong bullish signal.

Bearish RSI Divergence Bearish RSI divergence typically occurs when a currency pair’s price is trending higher and the RSI line is falling, which is a strong bearish signal.

Analyzing RSI Signals Although the RSI overbought signal occurs when the RSI line crosses over the 70 mark, the time to actually sell the currency pair is when the RSI moves out of the overbought region. This is because the price can sometimes stay in the overbought range for extended periods and this can cause major losses for a trader that jumps in too early.To put it another way, the initial cross above the 70 mark typically serves as a warning to traders that they should prepare to sell once the RSI crosses back below the 70 mark. The same case applies to the RSI oversold signal, which typically occurs once the RSI line crosses below the 30 mark. You shouldn’t actually buy until the RSI line moves out of the oversold area.Whenever you are trading with the RSI divergence indicator, always place a trade in the direction confirmed by the RSI line after the price of the currency pair has closed two to three candles in your preferred direction.

How To Place Stop Loss And Take Profit Levels When using the RSI indicator, you should ideally place your stop loss order slightly beyond the latest swing top or bottom that occurred before the price reversal that you are trading. Your ideal take profit level should be when the RSI line crosses above or below the centerline (50 level), at which point you should lock in some of your profits, if any, using a trailing stop. In some cases, the trend might reverse at or near the centerline, which is why this is a good take profit level.

A Word Of Caution Just because the RSI indicates that an overbought or oversold condition exists, you shouldn’t always expect a price reversal. A currency pair in a strong trend might stay in overbought or oversold conditions for a long time. Also, because the RSI is a leading indicator, it can generate a lot of false signals when the asset it is being used to measure displays strong trend characteristics. You should always use stop loss orders to minimize you risk exposure when trading using the RSI.

How To Calculate The RSI Although most modern trading platforms, such as the MetaTrader 4 and MetaTrader 5, can and will calculate the RSI for you automatically, understanding how these calculations are made is useful for gaining better insight into how the RSI works.

The default setting for the RSI is 14 periods.

RSI = 100 – [100 / (1 + RS)] — Where: RS (Relative Strength) = average gain / average loss

Here is how you find relative strength: calculate the gains of the last 14 reporting period and divide by zero. This is your average gain. Now find the average loss by adding up all the losses from the last 14 reporting periods and divide them by zero.

Once you have calculated the two, you divide the average gain by the average loss to find the Relative Strength (RS) and apply it to the RSI formula.

Conclusion The relative strength index indicator is a useful tool that helps traders predict reversals of existing trends. The indicator generates trading signals when overbought or oversold conditions exist as well as when bullish or bearish divergence is identified within an existing trend. Also, given that the RSI is a leading indicator, it is quite prone to generating false trading signals and should always be used together with other indicators for trade confirmations.

Found this article useful? Create a Demo account to try RSI today.

blog5

What Is The Best Forex Trading Platform For You?

Author:Exness Broker

As a trader, there are several factors that you should consider when choosing a forex trading platform. Some of these factors include your experience level, your trading preferences, and the tools you need for both technical and fundamental analysis.In this article, we shall analyze the different trading platforms offered by Exness to all its traders. Exness offers MetaTrader 4, MetaTrader 5, Mobile, WebTerminal, and MultiTerminal trading platforms.

MetaTrader 4 The MetaTrader 4 platform is one of the most popular forex trading platforms in the world and is used by millions of traders across the globe. This platform is quite easy to use and is ideal for traders getting started with forex for the first time. The MT4 platform offers 30 built-in indicators, as well as an additional 2,000 free custom indicators that any trader can download and use to perform their technical analysis.

The MT4 platform also allows traders to enter numerous types of orders depending on the market conditions, as well as allowing trading directly from the MT4 charts. The platform also allows traders to back test their trading ideas and strategies through the MT4 History Center.

MetaTrader 5 The MetaTrader 5 platform is an advanced version of the MT4 platform that offers more functionality such as the ability to execute more order types, and view the market across a wider range of time frames. This platform is well-suited to advanced traders who would benefit from the ability to build powerful EAs and sell them in the MetaTrader Market.

Mobile Platforms Given near universality of mobile devices such as smartphones and tablets, many traders are switching to mobile forex trading terminals in order to trade on the go. Although most mobile trading platforms offer limited functionality in terms of the tools available to traders, their main advantage is that they allow traders to trade wherever they are.Traders only require a stable internet connection and a mobile device that is compatible with their chosen mobile trading platforms, such as the MT4 and MT5 mobile trading platforms.

WebTerminal The WebTerminal is a trading platform that allows traders to trade directly from their web browser without having to download and install additional software. This is an excellent choice for traders who do not feel comfortable downloading trading software onto their computers, such as the MT4 or MT5 trading platforms. The WebTerminal is a stripped-down version of the downloadable trading software providing all the essential functionality with only the more advanced tools missing.

MultiTerminal The MT4 MultiTerminal is an advanced trading platform that allows traders to trade and manage different accounts. This platform is best suited for sophisticated traders with multiple accounts dedicated to trading different instruments, different strategies, or for the management of the accounts of other people.Institutional investors could also benefit greatly from this platform given their complex trading needs. The MetaTrader MultiTerminal allows traders to place new trades and allocate lots across different accounts simultaneously, which is vital for traders managing multiple accounts.

Conclusion To sum up, it is crucial to note that each of the above forex trading platforms has different functionalities that are suited to different types of traders.For most beginner traders, the MT4 platform is their best choice, although they might not utilize all of its functions. The choice of a trading platform is largely subjective and depends on a trader’s needs. The best course of action for most traders is to open a demo account in order to test their preferred trading terminal before engaging in live trading.