blog15

Want To Trade Forex Like An Expert? Your Trading Log Is Key

Why Study Your Trading Log?

Just as with keeping a journal, downloading and analysing your trading log — or the record of your trading history recorded on your trading platform — can be key to gaining valuable insights into the forex market.

You might notice, for example, that while you’ve opened many different positions on many different currency pairs over a certain period of time, only one or two (or none) turned a profit for you. This might be a sign that you are spreading your attention over too many trades and, thus, you should focus on fewer. On a similar note, you might find that you trade best early in the morning or late at night.

These are just examples, of course. The insights you uncover will, of course, be specific to you. Analyzing your past performance is key to discovering them.  

Top Tip: Studying Your Trading Log Can Be a Great Path To Growth

Your trading log can help you discover everything from the trading style that works best for you to what currency pairs or commodities you do best with. Ignore it at your peril.

Open Exness Demo Account


blog18

Want To Trade Forex Like An Expert? Plan Your Profits

Why Letting Profits Run Can Sometimes Pay Off

Just as many forex traders are too slow to cut their losses, many are also too quick to close their trades to claim their profits when a trade does go their way. Closing a trade too early prevents you from taking full advantage when, for example, a major market shift occurs in your favor. How do you avoid missing out? First, you can use an analytical tool like average true range (ATR) to predict periods of volatility in the market before they occur. How to recognize this? One sign can be periods of unusually low volatility. These often precede big swings up or down in the price of an item. When this is the case, you can use trailing stops, an automatic stop-out order you set with your broker where the limit follows the price upwards, or you can cash out only partially as your profits mount.


A trading plan is only as good as the strategy behind it — explore Popular Forex Trading Strategies to find one that suits your style.

Top Tip: Learning when to let profits run takes planning, time, and experience — but is well worth doing


Ready to put your plan into practice? Open a free Exness demo account and trade with discipline before risking real money.

Frequently Asked Questions

Q: What is a forex trading plan and why do I need one?

A trading plan is a written set of rules that defines your strategy, risk management, and goals. It tells you when to enter, when to exit, and how much to risk per trade. Without a plan, trading becomes gambling. Even experienced traders follow a strict plan to stay disciplined and consistent.

Q: What should a forex trading plan include?

A complete trading plan covers your trading strategy, the currency pairs you trade, your timeframe, risk per trade (typically 1-2% of account), entry and exit rules, and how you will review your performance. The simpler and clearer the plan, the easier it is to follow consistently.

Q: What is a trailing stop and how does it protect profits?

A trailing stop is an automatic order that follows the price upward as your trade moves in profit. If the price reverses by a set amount, the trade closes automatically — locking in your gains. It lets you ride a trend without having to watch the screen constantly.

Q: What is the Average True Range (ATR) indicator?

ATR measures market volatility by calculating the average price range over a set number of periods. Traders use it to set realistic stop loss and take profit levels based on actual market conditions rather than guessing.

Q: Why do expert traders close positions partially?

Partial closing allows you to lock in some profit while keeping part of the trade open to capture further gains. For example, closing 50% at the first target and letting the rest run with a trailing stop is a professional technique to maximize profits while managing risk.

Q: How do I start building a forex trading plan?

Start with one strategy, define your risk management rules, and test everything on a demo account before going live. Open your free Exness demo account here and build your plan with real market conditions and zero risk.


Tags:

AUD, Brexit, Brexit, Banks, CAD, CHF, CNH. currency hedging, CZK, Donald Trump, EU EUR, forex trading, GBP, Global, Growth, Fears, Gold Prices, Government Shutdown, HKD, Is forex trading profitable, JPY Leverage, Mean Reversion, MXN, NOK, NZD, Passive income, popular strategies, Risk Management, RUB, Safe, haven currencies, second referendum, SEK SGD, Silver, Price, technical indicators, trading account, Trading Basics, trading psychology, Trailing Stop, trump wall, TRY USD, USD Price, Chart, XAG, XAU, ZAR,

blog19

Bars, Lines, or Candlesticks? Reading Forex Charts Like a Pro

Are you struggling to find trading opportunities when you use fundamental analysis? News reports and eco releases can be strong influencers of market price, but sometimes they don’t give a clear enough indication of what to trade, and more investigation is called for. Time to check the forex charts!

Some traders use indicators to make sense of price history, while others prefer to “eyeball” the situation and make their own conclusions. Either way, it comes down to technical analysis and recognizing patterns in the price history, which brings us to the topic of this article. Which forex chart type reveals more? Should you use lines, bars, or candles? Here’s a simple breakdown of those options so you can start using the one that best suits your trading style.

Line charts

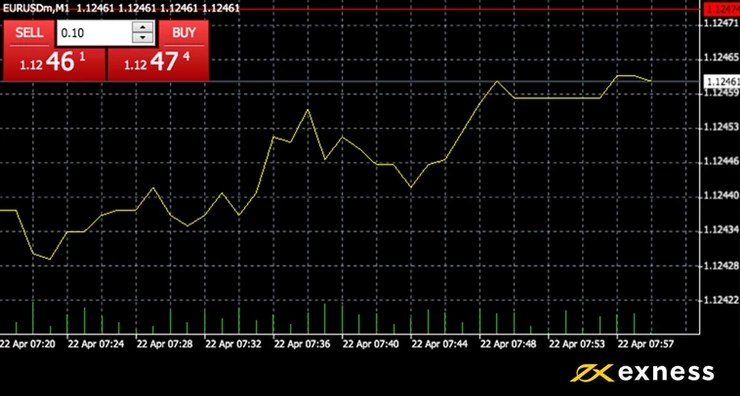
Right-click on an open forex chart and you’ll see three viewing options: lines, bars, and candlesticks. Lines display a currency pair’s price history in a much cleaner way. Lines track a simple straight line between the opening price and the closing price. Anything that happens between those two points will not be visible on a line chart. Since line charts don’t show the daily highs and lows, it makes them better suited to long-term analysis offering a wider simplistic overview. If you are planning to keep an order open for more than a week, then lines give a much cleaner picture from which to base forecasts. For short-term orders that present a risk of volatility, a bar chart is much more informative.


Bar charts

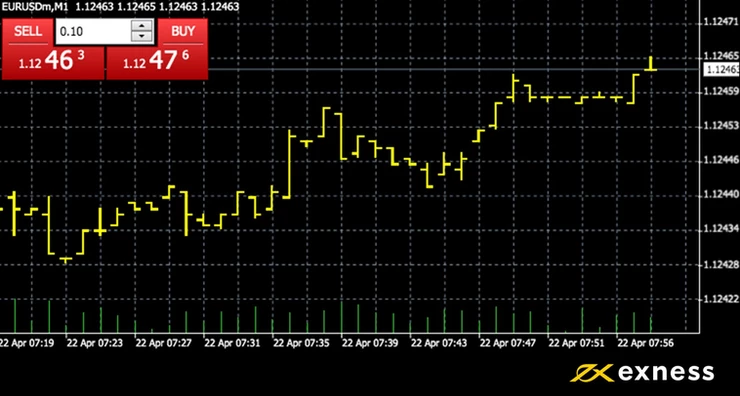
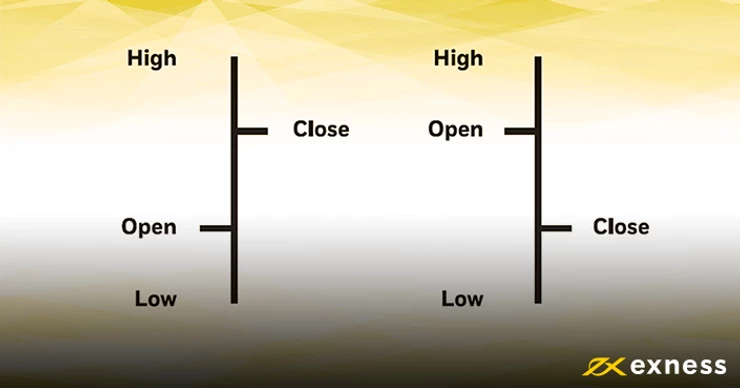
Like lines, bars also show the opening and closing prices, but bars display price highs and lows. The lowest and highest levels on each bar represent the lows and highs for the selected period. To the left of the bar is the opening price, to the right is the closing price

Most traders find bars harder to read than price lines, but there are certain advantages to using bars when performing technical analysis. When setting ‘Stop Loss’ (SL) and ‘Take Profit’ (TP), it can be useful to indicate just how extreme the lows and highs are compared to the closing prices. If the bars are long, but the opening and closing prices are crammed closer to the middle, it can mean that the selected period is experiencing price volatility. Extreme highs and lows tend to prematurely trigger a tight ‘SL’ or ‘TP’ order. If you’re opening a trade for the day, check the previous candlesticks to see if the wicks were far from the open and close? Set your ‘SL’ or ‘TP’ accordingly.


Candlestick charts

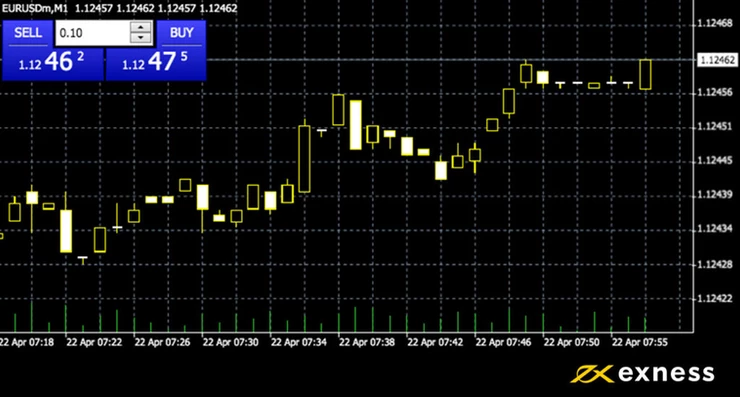
Candlesticks are probably the most popular way to view forex charts. This type of chart shows the same trading information as bars, but many traders prefer the style and insist that they are easier to read.Once you can read candlestick charts, the next step is learning momentum — see our guide on How to Use the RSI Indicator in Forex Trading.

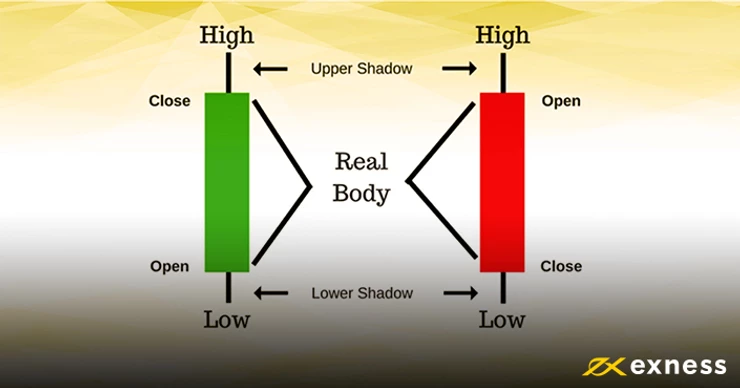
CSimilar to bars, the candlestick body shows the opening and closing prices, and the wicks that are sticking out of the top and/ or bottom represent the highs and lows of the selected period. The direction of the price for the period is shown by the color used. The most popular contrasts being green for a rise and red for a fall, but this is a completely customizable feature.

Just remember that the highs and lows never change, but the opening price on a candlestick switches place whenever the price direction changes. A rising trend opens on the bottom. A declining trend opens on the top. Candlesticks take a little getting used to, but when you do, there are dozens of patterns to watch out for that have a history of indicating rally moves or crashes.Chart reading becomes more powerful when combined with a strategy — explore Popular Forex Trading Strategies to put your skills into practice.


So which forex chart is better for forecasting?


Take a look at the three forex chart screenshots in this article. Which one seems the easiest to read or analyze? It’s really down to your own personal preference. Lines are great for a quick and easy overview, but they show much less when you’re looking at a one-minute timeframe. Consider using lines for long-term trading analysis or quick checks on how a fundamental release is affecting market prices. If you tend to open and close orders in the same day, candlesticks might be a better choice.Ready to apply what you’ve learned? Open a free Exness demo account and start practicing chart analysis with zero risk.


Test your analytical eye on the foreign exchange market


Open Exness Demo Account

Frequently Asked Questions

Q: What is the best chart type for forex trading beginners?
Candlestick
charts are the best starting point for beginners. They show open, close, high, and low prices for each period and make it easy to spot patterns and market sentiment at a glance.

Q: What is the difference between a bar chart and a candlestick chart?
Both
show the same price data (open, high, low, close), but candlestick charts use colored bodies that make it much easier to quickly identify bullish or bearish candles. Most professional traders prefer candlestick charts.

Q: Which timeframe should I use when reading forex charts?
It depends on
your trading style. Day traders typically use 5-minute to 1-hour charts. Swing traders prefer 4-hour or daily charts. Always check the higher timeframe first to understand the overall trend before going to a lower timeframe for entries.

Q: How do I identify a trend on a forex chart?
An uptrend consists of
higher highs and higher lows. A downtrend consists of lower highs and lower lows. Use the daily chart to identify the main trend before looking for entry signals on smaller timeframes.

Q: What indicators should I add to my forex chart?
Start simple — a 50 EMA
and 200 EMA for trend direction, and RSI for momentum. Avoid overloading your chart with too many indicators as this leads to confusion and conflicting signals.

Q: Where can I practice reading forex charts for free?
Open a free demo
account on Exness and use MT4 or MT5 to practice reading charts with real market data and no financial risk. Open your free Exness demo account here.


Tags:


AUD, Brexit, Brexit, Banks, CAD, CHF, CNH. currency hedging, CZK, Donald Trump, EU EUR, forex trading, GBP, Global, Growth, Fears, Gold Prices, Government Shutdown, HKD, Is forex trading profitable, JPY Leverage, Mean Reversion, MXN, NOK, NZD, Passive income, popular strategies, Risk Management, RUB, Safe, haven currencies, second referendum, SEK SGD, Silver, Price, technical indicators, trading account, Trading Basics, trading psychology, Trailing Stop, trump wall, TRY USD, USD Price, Chart, XAG, XAU, ZAR, indicator, Forex Millennium, Karl , golden rebate, rebate, cashback,



blog28

Do Forex Signals Really Work?

Do Forex Signals Really Work? What We Tell Our Own Clients

If you've spent any time in forex Telegram groups, you've seen the promises: "93% win rate," "200 pips this week," "copy my trades and get rich." As an Exness Introducing Broker working with thousands of traders since 2006, we get asked constantly: do forex signals actually work? Here's the honest answer, based on what we've actually seen play out in our clients' accounts — not marketing talk.

The Short Answer

Some signals work. Most don't — at least not consistently. The signal itself is rarely the deciding factor in whether a trader makes money. What actually determines the outcome is what the trader does around the signal: position sizing, stop-loss discipline, and whether they understand why the signal was given in the first place.

What We've Actually Seen

Over the years, working with active traders on our rebate program, a clear pattern has repeated itself:

  • Traders who blindly copy signals with no risk management tend to blow up their accounts within weeks — even when the signal provider's historical win rate looked good on paper.
  • Traders who use signals as one input alongside their own analysis — checking the reasoning behind a signal, sizing positions conservatively, and using stop-losses — do noticeably better, whether or not the specific signal was "correct."
  • Free signal groups with no verified track record are the riskiest category. If a provider can't show a real, broker-verified trading history (not just screenshots), treat every signal as unverified.

Why Signals Fail Even When They're "Right"

This is the part most articles on this topic skip. A signal can call the market direction correctly and still cost you money, because:

  • Position sizing mismatch: a signal built for a $10,000 account with a 50-pip stop loss can wipe out a $200 account in one trade.
  • Entry timing lag: by the time a signal reaches you (especially in busy Telegram groups), the price may have already moved past a favorable entry.
  • No exit plan: many signals give an entry and take-profit, but no plan for what to do if the market stalls or reverses before either level is hit.

A Better Alternative: Automate Your Own Rules

Instead of relying on someone else's signal, many of the traders we work with have moved toward Expert Advisors (EAs) — automated strategies that follow a fixed, tested set of rules on your own account, with your own risk settings. This removes the guesswork of "is this signal provider trustworthy today?" and replaces it with a system you can actually test and understand. If you're curious about this approach, our Exnessfarsi YouTube channel covers indicator and EA basics for Persian-speaking traders.

How to Evaluate Any Signal Provider (Free or Paid)

  1. Ask for a broker-verified track record (MyFXBook or similar), not just screenshots
  2. Check whether they specify stop-loss and position size, not just entry/target
  3. Test on a demo account first, for at least a month, before risking real funds
  4. Never risk more than 1–2% of your account per signal, regardless of how confident the provider sounds

The Bottom Line

Forex signals aren't a shortcut to consistent profit — they're, at best, one input into a broader trading process that still requires risk management and a clear plan. Whether you use signals, an EA, or your own analysis, the trading costs you pay on every position are real either way. That's exactly why we built our Exness cashback program — so that regardless of how you decide to trade, you get some of that cost back every month.

Want to learn more about reducing your trading costs directly? Check out our About page to see how our rebate program works, or read our full Exness Broker Review.