How Keeping A Journal Can Help You Grow And Improve As A Trader
Why? Simple. A journal is an invaluable tool for thinking through opportunities and risks, as well as for growing emotional self-awareness — a key part of trading.
A good trading journal should used for two purposes:
Use Number 1: Separating Facts From Interpretations
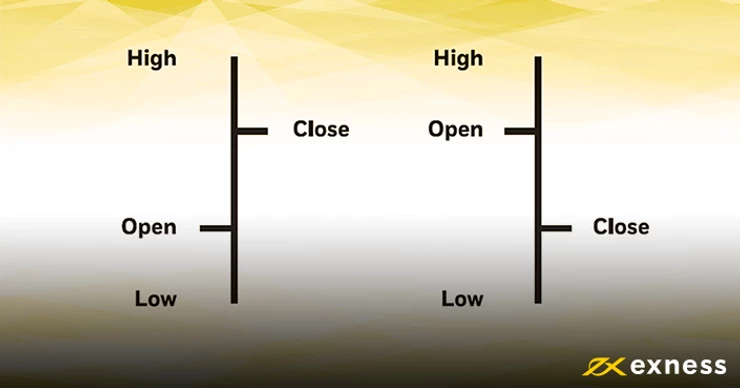
First, it should contain an analytical section where you can explore market facts and your interpretations of those facts. What do I mean by facts and interpretations? The highs and lows a currency pair reaches over the course of three days is a fact. So are the cost of spread, commissions, and amount of leverage you are using. However, the belief that the market may trend one way or another or the market will be strong or weak — these are interpretations. Learning to tell the difference between the two — and to question your interpretations — can lead to smarter, better forex trades. It can also help you spot opportunities you might otherwise have missed.
Use Number 2: Building Your Mental Game
Second, your journal should contain a section where you explore your thoughts and emotions towards the forex market and your performance on it. You should ask yourself questions like “What am I feeling right now?”, “What trading decisions do I normally make when I feel this way?”, and “What has usually been the result in the past? Did I lose or make money?” Exploring your emotions in this way can be a great way of developing emotional self-awareness and recognizing the many ways your emotional state impacts your trading — both are key traits of superior traders.
Top Tip: Keeping A Trading Journal Can Be Key To Your Development As A Trader
Open Exness Demo Account
Open FXTm Demo Account
Tags:
AUD, Brexit, Brexit, Banks, CAD, CHF, CNH. currency hedging, CZK, Donald Trump, EU EUR, forex trading, GBP, Global, Growth, Fears, Gold Prices, Government Shutdown, HKD, Is forex trading profitable, JPY Leverage, Mean Reversion, MXN, NOK, NZD, Passive income, popular strategies, Risk Management, RUB, Safe, haven currencies, second referendum, SEK SGD, Silver, Price, technical indicators, trading account, Trading Basics, trading psychology, Trailing Stop, trump wall, TRY USD, USD Price, Chart, XAG, XAU, ZAR,