blog12

Trading Strategy: Forget Price, Try Trading Volume

Are you ignoring the volume bars at the bottom of your price chart? It’s not unusual. Loads of traders prefer to track prices or

f

s when choosing a currency pair. At first glance, volume doesn’t seem to be the most powerful indicator, but there’s more to trading volume than meets the eye.


The volume section of your trading platform shows the total lots of the selected currency pair being bought or sold. For example, whenever heavyweight investors start opening huge trading contracts, trading volume quickly rises. Moreover, if the world’s media channels suddenly popularize a particular currency pair, trading volume tends to rise shortly after as thousands of traders open orders. In other words, trading volume is—among other things—a popularity meter. But how is that useful to you?

Volume and leverage

Before we even think about placing an order, we should first consider how volume relates to leverage. “Why leverage?” you may ask. What could volume and leverage have in common? Leverage is an important choice when you first go through the signup process. With Exness, you can open and manage multiple trading accounts from one convenient Personal Area. Each account can have a different leverage setting, which is very useful if you wish to trade both high volatility and low volatility pairs. The rule of leverage is simple and will give your trading strategy a solid foundation. low trading volume = low liquidity = high volatility = lower leverage

high trading volume = high liquidity = low volatility = higher leverage

A highly volatile currency pair could create huge profits when combined with high leverage, but such fragile orders tend to ‘Stop Out’ underfunded trading accounts in minutes when massive price fluctuations occur. Not recommended! Instead, try comparing the trading volumes of your favorite pairs with the major and minor currencies. If your pair is experiencing lower volume, then you might want to use a trading account with a lower leverage setting. Checking the volume of your preferred currency pairs could save you a lot of disappointment.

Strong price vs high price

Volume can be used to measure the ‘strength’ of a price shift, which answers a common question every trader asks themselves on a daily basis. “Is this price shift a coming reversal or just another bump in the road?”

Let’s consider a currency in a long-term downtrend. One day, the price begins to rise. Is this a breakout in the making, or just another fluctuation? A change in trend depends on many factors, but the first place to start checking is the trading volume. If the trading volume is low at the time of a price increase, then the market move is probably just a hiccup and the downtrend will return with a vengeance.

On the other hand, if the volume has been higher than usual, then you might be seeing the early stages of a price reversal. In a nutshell, low volume direction changes don’t stick. There are always exceptions to every trading strategy, but spotting a weak reversal is a very strong indicator.

How to test the trading strategy

Try opening up your trading platform and targeting a currency pair on the Market Watch list. Look back over the last few weeks until you find a significant fall in the trading volume, then check what happened to the price shortly after. Match your leverage to the average volume, then wait for the next possible breakout. If the price is reversing and the volume is rising, then the pair could be an attractive trading opportunity that deserves investigation or investment.


 

Open Exness Demo Account

Open FXTm Demo Account


blog11

3 More Economic Indicators You Need To Know

Forex indicators are crucial tools that can be used by all traders in order to improve to become more effective at what they do.

1. Bollinger Bands/Envelopes

Bollinger bands, also known as envelopes, were developed in the 1980s by John Bollinger to measure whether prices were high or low in relation to market volatility. Most traders use Bollinger bands to determine whether trend reversals are about to occur based on market volatility. Bollinger bands are made up of three bands with the middle band being the 20-period simple moving average of the currency pair. The values of the upper and lower bands are derived from the middle band (the upper band is calculated by adding two standard deviations from the middle while the lower band is calculated by subtracting two deviations from the middle). As a trader, you should stick to using the default values of the Bollinger bands as this is what most traders are using. Remember the price of a currency pair rarely strays far out of the Bollinger bands, which is why they are known as envelopes.

One of the most effective Bollinger bands trading strategies is the snapback to the middle band strategy, which is based on the fact that prices typically snap back to the middle band before heading in a specific direction.

2. The MACD Indicator

The term MACD indicator is an acronym for Moving Average Convergence Divergence indicator, which is a trend-following indicator used to measure momentum. Most traders use the MACD indicator to identify trend direction and to determine momentum and potential trend reversals The MACD indicator consists of the MACD line, the signal line and the MACD histogram. The MACD line and signal line move together although the MACD line is slightly faster than the signal line. As a trader, you can use the MACD indicator to generate trade signals, or to confirm trade signals generated by other trading strategies.

3. The ADX Indicator

The average directional index (ADX) indicator is used by most traders to identify whether a currency pair is trending or not. The ADX indicator was developed and introduced into the markets by J. Welles Wilder in 1978. The ADX indicator is used by forex traders to measure the strength of a trend, to identify trends and ranges, and as a filter for different trading strategies.

The ADX indicator is made up of the ADX line, the positive directional indicator (+DI) line and the negative directional indicator (-DI) line. The ADX indicator is calibrated from 0 to 100 with values above 25 indicating a strong trend while values below 25 identify ranging markets. You can also use the ADX indicator to confirm trades from other strategies as well as its own trade signals.

Conclusion

Tools like the Bollinger bands, MACD, and ADX can help you become a more effective trader and to make better trading decisions. While it is important to note that no indicator works all the time and to always apply proper risk management, learning about these three indicators is worth any new trader’s time.

Open Exness Demo Account

Open Hotforex Demo

Open FXTm Demo Account


blog10

How To Use The Parabolic SAR In Forex Trading

Have you ever wished you could tell when a trend in the forex market was likely to stop and reverse?   The parabolic stop and reverse (SAR) is an indicator designed to do just that. In this post, we’ll explore the parabolic SAR and teach you how to use it.

How The Parabolic SAR Works

The parabolic SAR typically plots dots or points on a currency pair’s chart that indicate potential areas when the price action might reverse.

When a forex chart is on an uptrend, the dots plotted by the parabolic SAR are typically below the candles. When the currency pair is in a downtrend, the reverse is true. The parabolic SAR dots usually appear close together whenever the trend is consolidating, while they are typically further apart in a strong uptrend or downtrend.

EUR/USD Chart With Parabolic SAR Indicator

It should be noted that the parabolic SAR only works in trending markets and you should not use it in choppy markets where the currency pair is trading sideways. These conditions typically generate a lot of false signals.

How To Enter And Exit Trades Using The Parabolic SAR

You can use the parabolic SAR to time your entries and exits to when a trend is about to reverse. For example, when a major uptrend is about to reverse, the parabolic SAR will typically form at least three dots above the candles to indicate that a downtrend may be about to begin. In such a case, you should exit your long trade, and enter into a short trade.

In cases where the prevailing trend is a downtrend, the parabolic SAR will typically form at least three dots below the trend to indicate that an uptrend may be about to begin. In such a case, you should exit your short trade and enter into a long trade once the parabolic SAR forms 3 dots below the candles.

Using The Parabolic SAR As A Trailing Stop

Some traders prefer to place their trailing stop loss orders at the level where a SAR dot appears within an established trend. In most cases, such a trader will rarely be stopped out of the position in a market with a strong uptrend or downtrend but will provide protection if the trend unexpectedly reverses. This can be a particularly useful feature for new traders who aren’t familiar with setting trailing stop losses in other ways.

It should be noted once again, however, that this does not work in ranging markets where the SAR typically whipsaws between positions.

Adjusting The Step

The sensitivity of the parabolic SAR is determined by the Acceleration Factor (AF), which is also known as the Step. The step is basically a multiplier that affects the rate of change or acceleration of the SAR. The default acceleration factor on the SAR is 0.02, but most charting programs allow traders to adjust this figure depending on their needs. The step has a minimum value of .01 and a maximum value of .20.

You can reduce the sensitivity of the SAR by decreasing the value of the AF, while you can increasing the parabolic SAR’s sensitivity by raising the value of the Step. When you lower the step, you move the SAR further from the price and reduce the chances of a reversal happening. By increasing the step, you move the SAR closer to the price, which increases the likelihood of a reversal.

When adding the parabolic SAR to a chart, there are two values that are required. One is the step, and the other is the maximum step. The value of the maximum step has a slight impact on the reversals identified by the SAR, but the step value carries more weight when compared to the maximum step.

Conclusion

The creator of the parabolic SAR designed it to analyse trends that last for about two to three weeks. However, this does not mean that it cannot be used on trends that last for a shorter or longer periods. We recommend you experiment with it and  test different values for the step and maximum step with a free Demo account to identify the values that allow you to ride a trend for the longest period.


Open Exness free Demo Account

Open FXTm free Demo Account

blog9

3 Ways MetaTrader 5 Has Improved On MetaTrader 4

How can you take something beloved by a global community and make it better? With MetaTrader4, MetaQuotes built a trading platform that has become the standard of retail forex traders around the world.

With the global trading community demanding more customization, greater control, and more capabilities, MetaTrader have gone one better and created a next-generation platform called MetaTrader 5.  

Available with Exness on Demo accounts, we wanted to give you a sneak peek at the features that make MetaTrader 5 special.

Customizable Approach To Trading: New Features In MT5

There’s nothing more frustrating than not being able to get your chart set up the way you want it, or not being able to place your order exactly the way you want it to be placed.

With MT5 a lot of these frustrations have been eliminated.

Timeframes. MetaTrader 5 offers 21 different timeframes, vs just nine in MetaTrader 4. This means you can get exactly the right chart for your trading strategy, rather than having to make do on MetaTrader 4.

Order types. In MetaTrader 5, you can access two additional pending order types, “buy stop limit” and “sell stop limit”. You can find out more about these in our blog post specifically on the subject of pending order types.

What’s more, with MetaTrader 5 subtle changes in the “navigator” pane mean that you can find what you want, when you want, at a far greater speed.

Analysis

The changes to MetaTrader 5 go beyond simple user experience. Improvements to analytics, testing, and tool building demonstrate how much MetaTrader 5 has been created with the experienced trader in mind.

Fundamental analysis. With MetaTrader 5, traders can benefit from access to economic and industrial news right within their terminal, as well as enjoying a economic calendar highlighting upcoming announcements from around the world. These new tools come bundled with MetaTrader 5 right from launch.Technical analysis. With MetaTrader 5, right out of the box traders get access to 38 indicators and 44 analytical objects, versus 30 indicators and 33 analytical objects in MT4, with a vast number of additional solutions available for free via Code Base or for a price from the new Market feature.

Expert Advisors

EAs were always remarkably valuable in MT4 because they allowed traders to automate some or all of their decision-making to a complex algorithm that could analyse trends and place orders.

In MT5 this functionality is further increased, made possible by the highly advanced MQL5 programming language.

Programming. MT5 is designed from the ground up to empower experienced traders to build powerful EAs themselves. With a programming language similar to C++, it is easy for traders to get their heads around the process and start building. At the same time, less experienced will benefit from access to better quality EAs, which they can test and apply.Market. Even more exciting for experienced traders is the new Market feature, which allows traders who have programmed EAs themselves to make money by selling them to the community, right from the terminal.

Using MetaTrader 5 With Exness

It couldn’t be easier to try out the MetaTrader 5 platform for yourself with Exness. Here’s a simple guide the getting started:

Open an MetaTrader 5 trial or MetaTrader 5 real account from your Personal AreaDownload the MetaTrader 5 desktop or mobile terminal from the Exness downloads pageEnter your account details to log in

What’s more, MT5 accounts can now be used with the WebTerminal. Accessible right from your personal area in the left-hand menu, this means you can start trading on MetaTrader 5 without anything to download!

Try it for yourself.

Open an EXNESS MT5 account today.


Open an FXTM MT5 account today.

blog8

Quasimodo Pattern (Over and Under)

Quasimodo Pattern (Over and Under)

TABLE OF CONTENTS:

Easy guide to trading the Quasimodo Pattern

What is the Quasimodo (Over and Under) Pattern?

Conclusion:

Easy guide to trading the Quasimodo Pattern

The Quasimodo Pattern or Over and Under pattern is a relatively new entrant to the field of technical analysis in the financial markets. Although new, the Quasimodo pattern is a commonly occurring theme that is more frequent when price carves a top or a bottom or when price begins a major correction to the trend.The Quasimodo Pattern, although complex as it might seem is actually very simple. This trading pattern is especially powerful because when it occurs, in most cases, traders will notice a confluence with other methods of analysis.For example, when a trader spots a Quasimodo pattern near a support or resistance level, it increases the confidence of the trader or the trading probability. Likewise, when trading divergences, when you spot a Quasimodo pattern, that confluence can be used to trade the divergence set up with more confidence.As we can see from the above, the Quasimodo pattern is not a trading strategy by itself but is more of a confluence pattern that can be used to confirm a trader’s bias. Of course, the Quasimodo pattern doesn’t appear all the time, but when it does, traders can be sure that the market offers a high probability trade set up.

What is the Quasimodo (Over and Under) Pattern?

A Quasimodo Pattern is simply a series of Highs/Lows and Higher or Lower highs or lows.

Quasimodo Short Signal Pattern

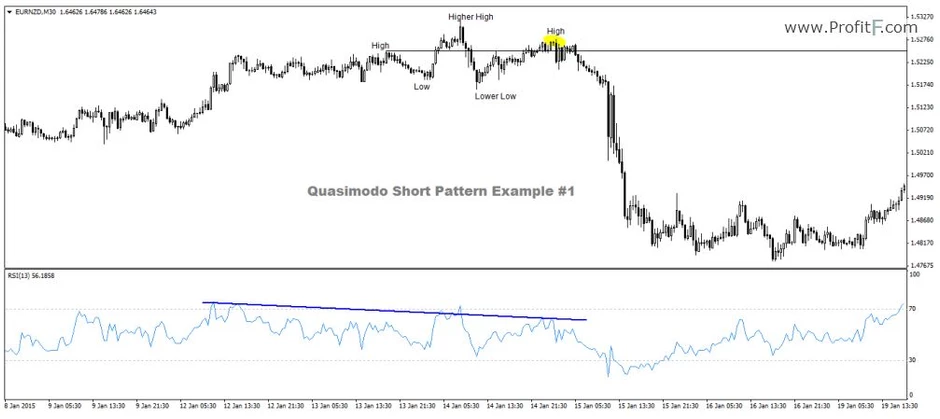
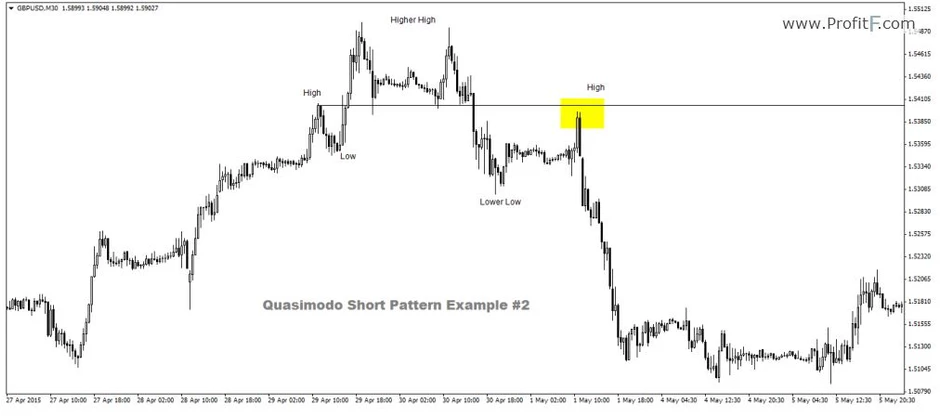
There should be a prior uptrend in the marketsPrice makes a new high, declines and makes a new local lowPrice then rallies above the previous high to mark a new higher highPrice then falls to form a new lower lowPrice then rises towards the initial high (but does not make a new higher high).

The fifth level in the set up is the trigger, where a short position is taken. Stops are set above the higher high and the take profit level is up to the trader.

Quasimodo Long Signal Pattern

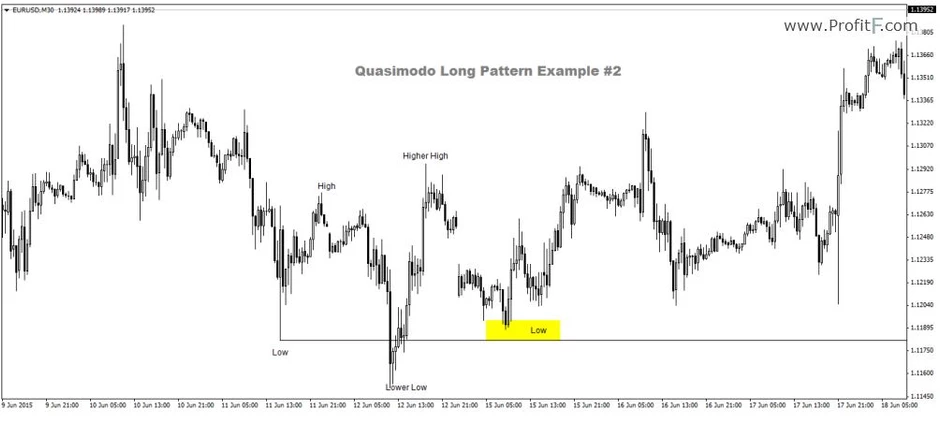
There should be a prior downtrend in the marketsPrice makes new low then makes a small rally and forms a local highPrice then declines to form a new lower low taking out the previous lowPrice then rallies to make a new higher high and then declinesThe final decline is equal to the first low

The fifth leg in this pattern is the trigger for long positions with stops set to at or below the lower low

Quasimodo Long Signal Pattern Examples:

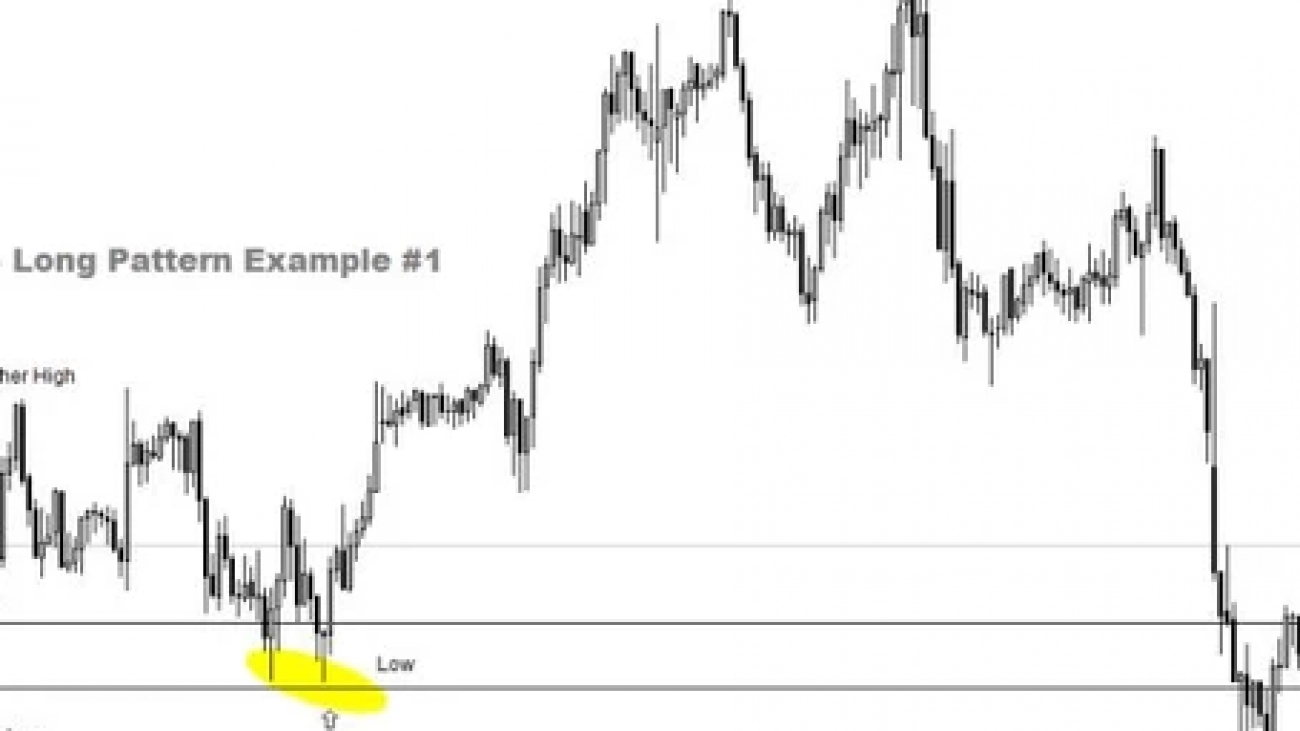
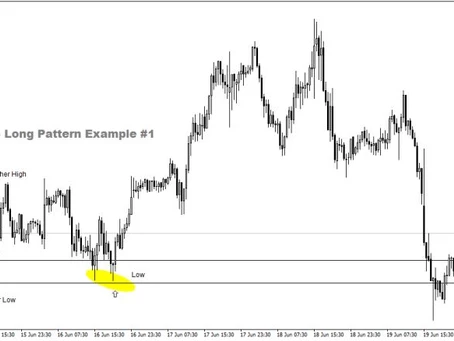
Quasimodo Long Example #1

Price is in a downtrendPrice then makes a new low at 99.923 and then makes a new local high at 100.274Price then declines and makes a new lower low at 99.983Price then rallies to make a new higher high at 100.38 and then declinesThe final leg in the decline is just a few pips above the previous low. This triggers a long signal

Here is another example of the Quasimodo Long example:

Quasimodo Long Example #2 Quasimodo Short Signal Pattern Examples:

Quasimodo Short Example #1

Price is in an uptrendPrice then makes a new high at 1.5251 and then declines to make a low at 1.5187Price then rallies to make a higher high at 1.5321 and then declinesA new lower low is posted at 1.5165Price then makes a modest rally and this high stalls a few pips close to/above the previous highA short entry is then taken with stops near the highest highThere is also an additional confirmation yet again with the RSI divergence as well

Another example of the Quasimodo Short pattern example is given below:

Quasimodo Short Example #2

Conclusion:

As we can see from the above, the Quasimodo or Over and Under pattern is a relatively simple pattern, which when used in conjunction with other trading strategies or signals offers a great way to increase the probability of a trade set up.
Open an Demo Account and test this pattern.