blog22-3

The Basics of Forex Theory An introduction to the Foreign Exchange, the Major Currencies and Reason

What is a Currency Pair ?

Currency is always measured against another currency and they are referred to as currency pairs. Currency pairs are generally segregated into groups. These groups are known as Majors, Minors and Exotics. Major currency pairs are generally the most popular traded currency pairs. Almost all currencies are free floated, meaning that they don’t have a set representation of value to another currency and can rise and fall in value independently. Some of currency pairs offered by HotForex available for trading are:


What is a Pip ?

A pip is a small measurement of change in the underlying currency. Generally, it is the forth (0.0001) decimal place of a currency price, except with the Japanese Yen, where they have no denomination for cents in their currency (in the Japanese Yen, the pip is the second decimal place). Shown below is an image representing an order window reflecting the price of the AUD/USD Currency Pair

The fourth decimal place is circled red to show which decimal the pip is in reference to. If the price 0.84693 moves to 0.84683 then there was a 1 pip movement. Please note that the fifth decimal represents 1/10th of a pip.


A pip is a good reference measure to how much a trader can make based on the volume of their trades. For example, if a trader purchases a full contract the value of potential return and risk is $10 profit or loss (of the second named currency in a pair) per pip movement. You can follow the table below as a reference to potential risk or return:


Quite often, the annotation used to measure how well a trader is doing is to mention how many pips they have gained in a set time period.

What is Bid & Ask and Spread ?

With currency quotes, they are always represented with a Bid offer and an Ask offer. This denotes the price difference between buying and selling.

If you BUY, you are buying at the ASK price. if you SELL, you are selling at the BID price. Shown below is a list of currency pairs all showing a Bid and Ask offers.

Remember, if you opened a BUY position and you wish to close it, you are essentially selling it back, therefore the price you will be closing the position at is the BID price and vice versa.

The spread is the pip difference between the BID and ASK. If you were to look at the above image and referred to the AUD/USD then you will notice the BID as 0.84767 and the ASK as 0.84786.

This is a spread of 1.9 pips. 0.84786 – 0.84767 = 0.00019 0.00019 = 1.9 pips

What is Leverage and How much do I need to trade ?

Leverage is the amount that you are borrowing based on the deposit in your account. Default leverage is set at 100:1, meaning that for every $1 you have in your account, you have a buying power of $100. If you have $1,000 in your account, you have buying power of $100,000. Something to remember is a full contract is $100,000 of the base currency. So if you were looking to trade a Full Lot of the EUR/USD, then you would need the equivalent of EUR$100,000 in your account to trade this. If you wanted to trade a full contact and you had a leverage of 500:1, then you could take this position with only $200 in your account ($200 x 500 = $100,000). High leverage can help you take larger positions based on smaller capital in your account, but it is not without its pit falls. Larger positions result in larger dollar movements per pip and as such can wipe out smaller capital amounts in a short period of time.

Open Exness Demo Account

Open FXTm Demo Account

blog21

Hedging vs Stop Loss

It’s not so hard to find an attractive currency pair to trade after spending an hour or two on your technical and fundamental analysis, but how can you protect your trading account from those unexpected and rapid crashes that happen from time to time?

It’s not so hard to find an attractive currency pair to trade after spending an hour or two on your technical and fundamental analysis, but how can you protect your trading account from those unexpected and rapid crashes that happen from time to time?

If you’ve been using Stop Loss, then there’s a chance that you may have missed a rally or two; as a result you may have ended up losing when you could potentially have seen some significant gains. Read on to discover whether there’s an alternative to Stop Loss that will ensure your orders don’t get closed prematurely, keeping you in with a chance to take full advantage of the next big rally. But first, let’s look at how Stop Loss actually works.

How Stop Loss works

If you’re trading a volatile currency, setting a Stop Loss just seems like the smart thing to do. After all, the forex market never sleeps, and anything can happen while you’re away from your trading platform. Stop Loss is a pending order, that will automatically activate when market conditions reach or match the level you specified, but this type of order has a weak point that many new traders discover the hard way.

Let’s use some simple numbers to explain the problem.

A USDJPY Buy order at 111.300

Take Profit at 111.400

Stop Loss at 111.280

If the price falls to 111.280, your Stop Loss will protect you from losing more money as it will automatically close your order. But what happens if the price bounces back up to 111.300 or above? Huge disappointment! Have you ever gone back to your trading platform to check your order after a few hours, saw that the price was on the rise, but then realised that your order had already been closed by a brief downward spike? Such price moves are often a source of frustration and complaint, especially with volatile pairs or during economic releases. Thankfully, there is an alternative to Stop Loss.

How hedging solves the problem

Consider setting a pending hedging order instead of a Stop Loss. Hedging also offers protection from huge losses, but it won’t close your order. Let’s use the same USDJPY order to see how a pending hedging order performs.

Buy order at 111.300

Take Profit at 111.500

Pending Sell order to activate if the price hits $111.280

If the price falls to $111.280, the hedging order activates. From that point, the hedging Sell order will offset any losses to the original Buy order. Your account will not suffer, no matter how low the price goes. And, your Buyorder is still active if a rally is just around the corner.

When to stop the hedging order

If the price goes down, bounces back, and eventually moves into a rally, then your Buy order will profit as you intended, but your hedging Sell order is losing now, and eating away at your Buy order profit. What can you do?

Consider setting a Stop Loss for your hedging Sell order at the entry point of the original Buy order. This way, when the rally kicks off, the hedging Sell order will be closed and you’ll enjoy all the benefits of the rally. You’ll take a slight loss from your hedging Sell order, but at least your Buy order remains active and ready to reap the rewards of the rally. Some might say a fair tradeoff worthy of the fuss.

Word to the wise

Play around with the Exness demo account to better understand this strategy. Only after you get familiar with the mechanics of hedging should you consider trying it for real. With such protection in place, you’ll be able to use a higher leverage, even if market volatility is rampant.

Using hedging instead of Stop Loss is not a bulletproof solution. If, in the example we used above, the price falls then continues to fall, you cannot profit, and you’ll end up closing both orders with a small loss. Using such trading tools can make a huge difference to your trading performance. The little things make a big difference and often separate the beginners from the professionals.

Open Exness Demo Account

Open FXTm Demo Account


The Basics of Forex Theory An introduction to the Foreign Exchange, the Major Currencies and Reasons

Foreign Exchange Definition

Foreign exchange (Forex) is the cross-country exchange of currencies and is, single handedly, the largest and most liquid financial market in the world. With an estimated $1.5 trillion in currencies traded in a single day, it eclipses the trading of other types of commodities. Unlike other commodity trading, Forex has no centralized exchange and is traded primarily through banks, brokers, dealers, financial institutions and private individuals. Due to this ability for financial institutions to trade Forex, the Forex market is open 24 hours, 5 days a week (closes Saturday morning).

Prior to the late 1990’s, Forex trading was only the practice for institutional traders and even though retail traders had access to trade the Forex market, only recently has it become popular and more common for individuals to trade Forex for profit. Most of the world’s different country currencies are free floating; meaning they retain an individual value and will appreciate and depreciate against other currencies. Currencies are always listed in pairs as they need another currency to benchmark against.

Reasons for Trading Forex

Trading Forex has many purposes and you’ll be surprised of the many levels traded that impact you and you’re not even be aware of it. For every purchase you make, the contents, ingredients, by-products, parts or materials may not necessarily be from a domestic source. It could have been bought internationally and as such the exchange of foreign currency would have had to be taken place.

From a financial perspective, some people may trade the Forex market for profit. By taking a cross currency pair, they may exchange currency to a foreign designation hoping for domestic currency values to depreciate, thus when you convert it back you will receive more than you initially started.

For international importer or exporter of goods and services, there are great opportunities by having access to the international market. However, with fluctuating international currency rates, payment can sometimes be difficult. Initially companies make a sale for an agreed price, then on the day of payment the agreed value is significantly less than agreed to, due to a currency fluctuation is known as foreign exchange risk.

You will find all types of businesses, from large financial institutions to small retail freight forwarders will practice foreign exchange hedging. Simply put, these companies will put in place measure to ensure that their agreed payment value will represent the same value at the day of payment regardless of currency value fluctuations.

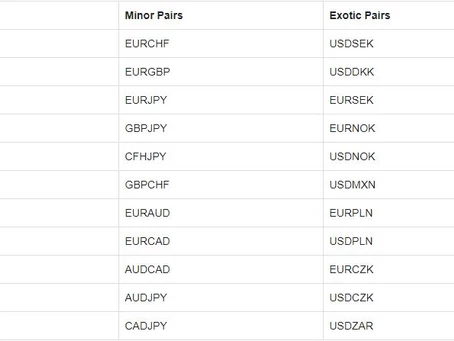
The Eight (8) Major Currencies

Internationally, there are eight (8) currencies that are traded more than other currencies. These are often referred to as Majors. These currencies are as follows:

USD – Unites States Dollar

JPY – Japanese Yen

GBP – British Pound

CAD – Canadian Dollar

EUR – European Currency Unit

CHF – Switzerland Dollar

AUD – Australian Dollar

NZD – New Zealand Dollar.

Certain parts of the world have part of their Saturday to trade, as it’s still Friday in other markets.
Financial institution in these countries may be dealing with the Forex market during their work hours, the Forex market is open and trading 24 hours, 5 days a week. For someone living in the East Coast of Australia, the market hours for the corresponding markets are outlined below:

New York session opens at 10:00pm and ends around 7:00am

Sydney session starts at 7:00am and ends around 4:00pm

Tokyo session begins at 9:00pm and ends around 6:00am

London opens at 5:00pm and ends around 2:00am.


Open FXTm Demo Account


blog28

Do Forex Signals Really Work?

So, you’ve funded your trading account, and you’re ready to make some trades. Now it’s time to analyze the market and find some attractive trading options. Researching currency pairs can take a big chunk out of your free time, and it’s not uncommon to end your market investigation as lost as when you started. If that’s you, don’t despair. You’re not alone, which is why professional market analysts and A.I. programmers got together to create forex signals. But are those signals any good?

Why do traders use forex signals?

Technical indicators, news reports, fundamental analysis, who has time to analyze the dozens of trading instruments available on your trading platform? If your life is like mine, it’s hard to find time to properly research the market. But what if somebody or something could do all the research for us and then send a report with statistics and clear conclusions?

It’s so convenient. Forecasts that normally take hours to perform just appear in your inbox or MetaTrader message board in the form of a signals report, all thanks to a team of professional forex analysts working in concert with A.I. technology.

Traders of all levels and experience use signal provider services and their associated apps. While some forex signals services are free, others have a fee; there are hundreds, so choosing which one to go with takes time and investigation. Moreover, some work better than others.


Which forex signals providers can you trust?

This question is difficult to answer. Forex signals get constant updates and performance changes with each update. Signal performance and accuracy also varies from brand to brand. From as low as 60% up to an unconfirmed 92% win/loss ratio. One forex signal provider’s performance might be strong during the time of writing this article, but things can change in a matter of days. Keeping current with the top signal providers can take up as much time as keeping current with the forex market. Fortunately, there is a solution.

The easy way to choose a signal provider

To make sure you’re getting the latest forex signals, just stick to the more established and popular services. There’s a reason they are so popular! One signal provider worth considering in 2019 is the award-winning Trading Central. For almost 20 years, Trading Central has been supporting investment decisions for forex traders, and it is a consistent leader in the industry. Professional analysts monitor Trading Central’s tried and tested algorithms, and their performance and reputation is solid, which is why Exness gives free access to Trading Central signals directly on your trading platform.

Top tip: Some signal providers have had better performance percentages than Trading Central, but their consistency is lacking and not really worth mentioning. Try comparing multiple signal providers. Keep a diary of the signal forecasts then go back and check to see which ones gave better signals. If the majority of signal providers are saying the same, then you might be onto a sure thing.

As always, FX News recommends that you understand every order you make, and not blindly follow forex signals or forecasts. Find time to conduct your own market research and learn and grow as you go.

Try signals trading and see if it’s right for you!


Open Exness Demo Account

Open Tickmill Demo Account

Open FXTm Demo Account

blog25

Indicators 101: How to Use Fibonacci Retracement

In this article, I’m going to show you how to apply Fibonacci retracement levels to a chart and what information it provides. Remember, indicators “indicate” possible price moves and entry-exit points. You’ll still need to interpret the data for yourself, so I’ll show you how to do that too.


What is Fibonacci retracement

Let’s break down the words Fibonacci and retracement to better understand what this tool does.

Fibonacci was an Italian mathematician who discovered a sequence of numbers that occurs in nature. This infinite sequence is created by adding together the preceding two numbers on the list to create the next number. For example: 0, 1, 1, 2, 3, 5, 8, 13, 21, etc.

Retracement refers to how a price trend can sometimes temporarily fall back before continuing in the direction of the trend.

Why is Fibonacci retracing so useful?

The Fibonacci Retracement tool helps traders identify levels for setting Buy Stop Limits or Sell Stop Limits that can activate orders whenever a price retracement occurs. The indicator lines also help when searching for a trading entry point level on a trending price move.

How to set up Fibonacci levels

Open your Exness demo account and let’s apply the Fibonacci tool to a chart. EURGBP often displays volatility. It’s a perfect pair to demonstrate how the Fibonacci tool can help you set a more profitable order prior to a price retracement. On the top menu of your trading platform, set the timeframe to H4 (4 hourly) and display the price as a line.

Go to the top menu >> Insert >> Fibonacci >> Retracement

On the chart, draw a line at the start of a trend to the point of reversal by holding down the left mouse button until you get to the break.

If a retracement occurs, how low will it go? That’s where the yellow lines or levels can help with your forecasting. The displayed Fibonacci levels or lines offer several entry points. Assuming the trend continues, the higher the line value the greater the profit. These entry points levels can be customized, but most traders don’t mess with the defaults. So which level should you choose for your entry point?

Fibonacci retracement entry points

In the example above, EURNZD started a bull run at 4:00 pm on March 26. A retracement began four hours later. The Fibonacci tool displays six levels ranging from 0.0 (no retracement) to 100.0 (full reversal). Choosing the right level is ultimately your decision, but the Fibonacci levels work as an effective guideline or benchmark. Just remember that an indicator is not a time machine and market prices don’t always follow the mathematical rules.

23.6: A small move that happens all the time and offers limited value or improved profitability.

38.2: An accurate forecast at this level creates attractive profits, and the likelihood of it occurring remains quite high.

50.0: Half retracement. Not a tall order by any means, but the improvement to your profit ratio improves significantly—compared to opening a position on the high.

61.8: Entering the realm of more and more unlikely. To catch such a reversal in the middle of a rally is a long shot, but highly profitable when it happens.

Most conservative traders will probably set entry levels between 23.6 and 50.0 but that number will rise as your knowledge and experience grows.

In the example above, the reversal dropped to the 38.2 mark and then continued to rally well beyond the price at the time of drawing the Fibonacci lines.

Top Fibonacci trading tip

Remember, market prices won’t always fit in with Fibonacci levels so perfectly. Many unexpected changes can and will affect your orders if you trade on a daily basis. Most traders agree that the longer the timeframe and greater the price difference, the more accurate the forecast.

Trading indicator tools can be likened to comments on Amazon. You’ll get better results in the long-term if you take more than one into consideration, so work hard and use other indicators together with fundamental analysis.

Test the Fibonacci trading tool on a real or demo account


Open Exness Demo Account

Open Alpari Demo Account


The Breakout Strategy

The Breakout Str

News Release Trading Strategy

News traders trade off economic news release. The Forex market is particularly reactive to economic news, in particular, interest rate news from the G8 countries, as well as unemployment news for each corresponding country. News traders will have to bear in mind that the Forex market movements have already taken in to consideration existing and expected economic news. The sharp movements you see due to economic news are corrections due to unexpected news, either better than expected or worse than expected.

Another consideration to take to heart for potential news traders is that during negative sentiment news reports, currency movements generally head towards lower yielding and perceived safer currencies; USD and JPY in particular.

A good grasp of economics is generally recommended for traders wishing to start news releasing trading.

An economic news calendar is highly recommended. Forex Economic calendars show the release date for important economic news such as non-farm payroll, GDP figures and interest rate news. Below is an example of what an economic calendar shows:

ategy is the break out of a sideways trend. Usually, momentum is greatest on breakout points. A lot of traders take advantage of the breakout strategy when sideways moving prices break the upper or lower limits. Below represents a few breakouts following some periods of sideways tending.