blog12

Trading Strategy: Forget Price, Try Trading Volume

Are you ignoring the volume bars at the bottom of your price chart? It’s not unusual. Loads of traders prefer to track prices or

f

s when choosing a currency pair. At first glance, volume doesn’t seem to be the most powerful indicator, but there’s more to trading volume than meets the eye.


The volume section of your trading platform shows the total lots of the selected currency pair being bought or sold. For example, whenever heavyweight investors start opening huge trading contracts, trading volume quickly rises. Moreover, if the world’s media channels suddenly popularize a particular currency pair, trading volume tends to rise shortly after as thousands of traders open orders. In other words, trading volume is—among other things—a popularity meter. But how is that useful to you?

Volume and leverage

Before we even think about placing an order, we should first consider how volume relates to leverage. “Why leverage?” you may ask. What could volume and leverage have in common? Leverage is an important choice when you first go through the signup process. With Exness, you can open and manage multiple trading accounts from one convenient Personal Area. Each account can have a different leverage setting, which is very useful if you wish to trade both high volatility and low volatility pairs. The rule of leverage is simple and will give your trading strategy a solid foundation. low trading volume = low liquidity = high volatility = lower leverage

high trading volume = high liquidity = low volatility = higher leverage

A highly volatile currency pair could create huge profits when combined with high leverage, but such fragile orders tend to ‘Stop Out’ underfunded trading accounts in minutes when massive price fluctuations occur. Not recommended! Instead, try comparing the trading volumes of your favorite pairs with the major and minor currencies. If your pair is experiencing lower volume, then you might want to use a trading account with a lower leverage setting. Checking the volume of your preferred currency pairs could save you a lot of disappointment.

Strong price vs high price

Volume can be used to measure the ‘strength’ of a price shift, which answers a common question every trader asks themselves on a daily basis. “Is this price shift a coming reversal or just another bump in the road?”

Let’s consider a currency in a long-term downtrend. One day, the price begins to rise. Is this a breakout in the making, or just another fluctuation? A change in trend depends on many factors, but the first place to start checking is the trading volume. If the trading volume is low at the time of a price increase, then the market move is probably just a hiccup and the downtrend will return with a vengeance.

On the other hand, if the volume has been higher than usual, then you might be seeing the early stages of a price reversal. In a nutshell, low volume direction changes don’t stick. There are always exceptions to every trading strategy, but spotting a weak reversal is a very strong indicator.

How to test the trading strategy

Try opening up your trading platform and targeting a currency pair on the Market Watch list. Look back over the last few weeks until you find a significant fall in the trading volume, then check what happened to the price shortly after. Match your leverage to the average volume, then wait for the next possible breakout. If the price is reversing and the volume is rising, then the pair could be an attractive trading opportunity that deserves investigation or investment.

 

Open Exness Demo Account

Open FXTm Demo Account


blog9

3 Ways MetaTrader 5 Has Improved On MetaTrader 4

How can you take something beloved by a global community and make it better? With MetaTrader4, MetaQuotes built a trading platform that has become the standard of retail forex traders around the world.

With the global trading community demanding more customization, greater control, and more capabilities, MetaTrader have gone one better and created a next-generation platform called MetaTrader 5.  

Available with Exness on Demo accounts, we wanted to give you a sneak peek at the features that make MetaTrader 5 special.

Customizable Approach To Trading: New Features In MT5

There’s nothing more frustrating than not being able to get your chart set up the way you want it, or not being able to place your order exactly the way you want it to be placed.

With MT5 a lot of these frustrations have been eliminated.

Timeframes. MetaTrader 5 offers 21 different timeframes, vs just nine in MetaTrader 4. This means you can get exactly the right chart for your trading strategy, rather than having to make do on MetaTrader 4.

Order types. In MetaTrader 5, you can access two additional pending order types, “buy stop limit” and “sell stop limit”. You can find out more about these in our blog post specifically on the subject of pending order types.

What’s more, with MetaTrader 5 subtle changes in the “navigator” pane mean that you can find what you want, when you want, at a far greater speed.

Analysis

The changes to MetaTrader 5 go beyond simple user experience. Improvements to analytics, testing, and tool building demonstrate how much MetaTrader 5 has been created with the experienced trader in mind.

Fundamental analysis. With MetaTrader 5, traders can benefit from access to economic and industrial news right within their terminal, as well as enjoying a economic calendar highlighting upcoming announcements from around the world. These new tools come bundled with MetaTrader 5 right from launch.Technical analysis. With MetaTrader 5, right out of the box traders get access to 38 indicators and 44 analytical objects, versus 30 indicators and 33 analytical objects in MT4, with a vast number of additional solutions available for free via Code Base or for a price from the new Market feature.

Expert Advisors

EAs were always remarkably valuable in MT4 because they allowed traders to automate some or all of their decision-making to a complex algorithm that could analyse trends and place orders.

In MT5 this functionality is further increased, made possible by the highly advanced MQL5 programming language.

Programming. MT5 is designed from the ground up to empower experienced traders to build powerful EAs themselves. With a programming language similar to C++, it is easy for traders to get their heads around the process and start building. At the same time, less experienced will benefit from access to better quality EAs, which they can test and apply.Market. Even more exciting for experienced traders is the new Market feature, which allows traders who have programmed EAs themselves to make money by selling them to the community, right from the terminal.

Using MetaTrader 5 With Exness

It couldn’t be easier to try out the MetaTrader 5 platform for yourself with Exness. Here’s a simple guide the getting started:

Open an MetaTrader 5 trial or MetaTrader 5 real account from your Personal AreaDownload the MetaTrader 5 desktop or mobile terminal from the Exness downloads pageEnter your account details to log in

What’s more, MT5 accounts can now be used with the WebTerminal. Accessible right from your personal area in the left-hand menu, this means you can start trading on MetaTrader 5 without anything to download!

Try it for yourself.

Open an EXNESS MT5 account today.


Open an FXTM MT5 account today.

blog22-3

The Basics of Forex Theory An introduction to the Foreign Exchange, the Major Currencies and Reason

What is a Currency Pair ?

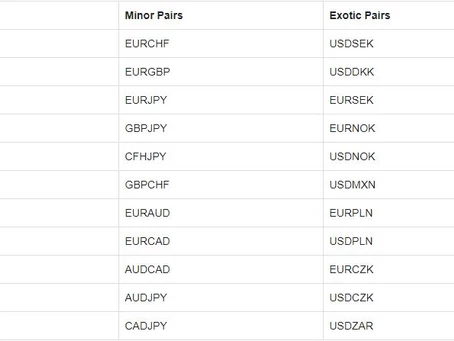
Currency is always measured against another currency and they are referred to as currency pairs. Currency pairs are generally segregated into groups. These groups are known as Majors, Minors and Exotics. Major currency pairs are generally the most popular traded currency pairs. Almost all currencies are free floated, meaning that they don’t have a set representation of value to another currency and can rise and fall in value independently. Some of currency pairs offered by HotForex available for trading are:


What is a Pip ?

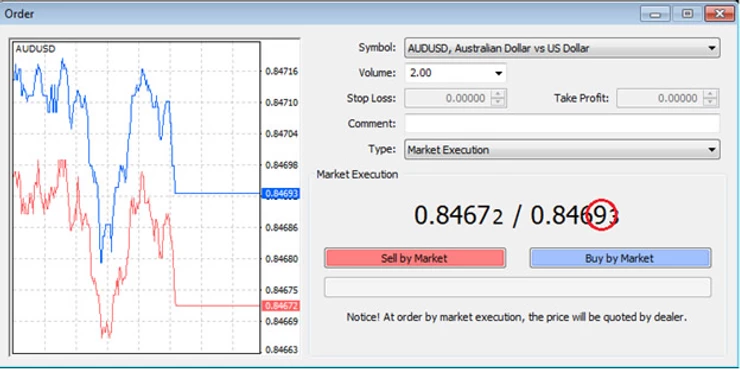
A pip is a small measurement of change in the underlying currency. Generally, it is the forth (0.0001) decimal place of a currency price, except with the Japanese Yen, where they have no denomination for cents in their currency (in the Japanese Yen, the pip is the second decimal place). Shown below is an image representing an order window reflecting the price of the AUD/USD Currency Pair

The fourth decimal place is circled red to show which decimal the pip is in reference to. If the price 0.84693 moves to 0.84683 then there was a 1 pip movement. Please note that the fifth decimal represents 1/10th of a pip.


A pip is a good reference measure to how much a trader can make based on the volume of their trades. For example, if a trader purchases a full contract the value of potential return and risk is $10 profit or loss (of the second named currency in a pair) per pip movement. You can follow the table below as a reference to potential risk or return:


Quite often, the annotation used to measure how well a trader is doing is to mention how many pips they have gained in a set time period.

What is Bid & Ask and Spread ?

With currency quotes, they are always represented with a Bid offer and an Ask offer. This denotes the price difference between buying and selling.

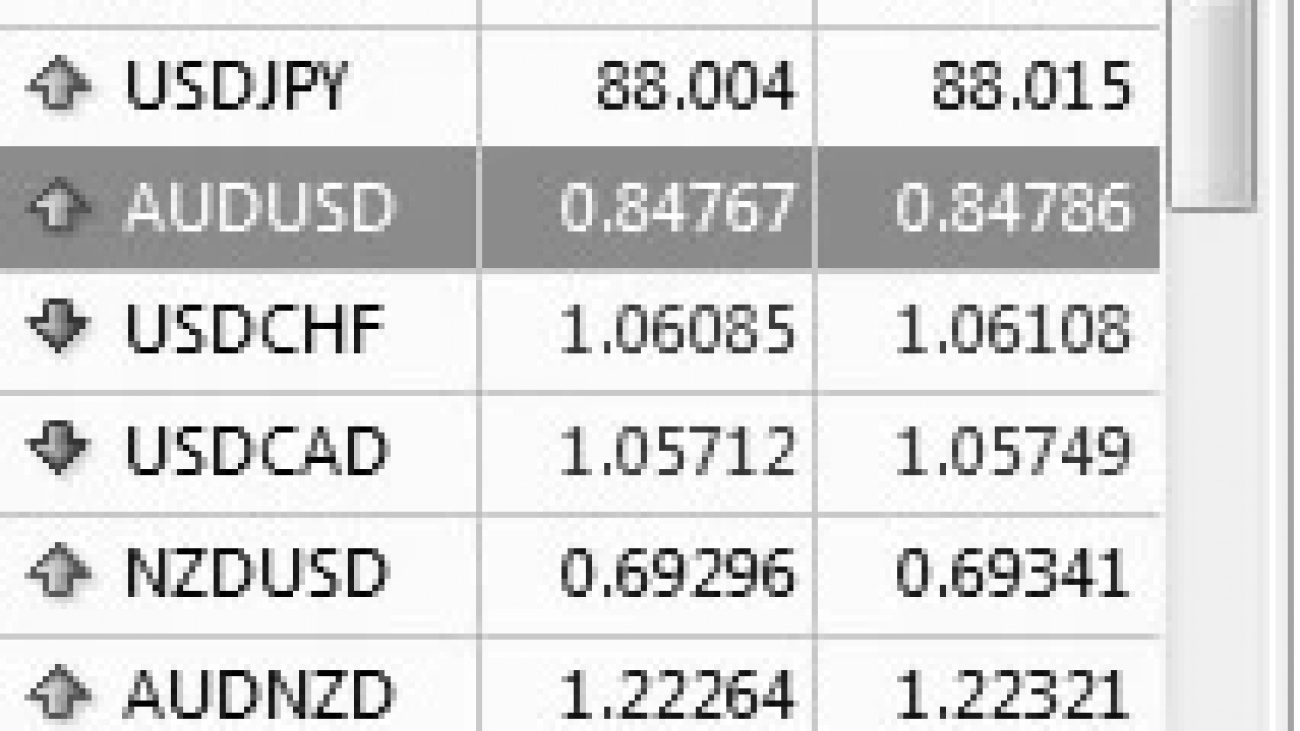
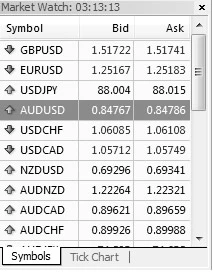
If you BUY, you are buying at the ASK price. if you SELL, you are selling at the BID price. Shown below is a list of currency pairs all showing a Bid and Ask offers.

Remember, if you opened a BUY position and you wish to close it, you are essentially selling it back, therefore the price you will be closing the position at is the BID price and vice versa.

The spread is the pip difference between the BID and ASK. If you were to look at the above image and referred to the AUD/USD then you will notice the BID as 0.84767 and the ASK as 0.84786.

This is a spread of 1.9 pips. 0.84786 – 0.84767 = 0.00019 0.00019 = 1.9 pips

What is Leverage and How much do I need to trade ?

Leverage is the amount that you are borrowing based on the deposit in your account. Default leverage is set at 100:1, meaning that for every $1 you have in your account, you have a buying power of $100. If you have $1,000 in your account, you have buying power of $100,000. Something to remember is a full contract is $100,000 of the base currency. So if you were looking to trade a Full Lot of the EUR/USD, then you would need the equivalent of EUR$100,000 in your account to trade this. If you wanted to trade a full contact and you had a leverage of 500:1, then you could take this position with only $200 in your account ($200 x 500 = $100,000). High leverage can help you take larger positions based on smaller capital in your account, but it is not without its pit falls. Larger positions result in larger dollar movements per pip and as such can wipe out smaller capital amounts in a short period of time.

Open Exness Demo Account

Open FXTm Demo Account

The Basics of Forex Theory An introduction to the Foreign Exchange, the Major Currencies and Reasons

Foreign Exchange Definition

Foreign exchange (Forex) is the cross-country exchange of currencies and is, single handedly, the largest and most liquid financial market in the world. With an estimated $1.5 trillion in currencies traded in a single day, it eclipses the trading of other types of commodities. Unlike other commodity trading, Forex has no centralized exchange and is traded primarily through banks, brokers, dealers, financial institutions and private individuals. Due to this ability for financial institutions to trade Forex, the Forex market is open 24 hours, 5 days a week (closes Saturday morning).

Prior to the late 1990’s, Forex trading was only the practice for institutional traders and even though retail traders had access to trade the Forex market, only recently has it become popular and more common for individuals to trade Forex for profit. Most of the world’s different country currencies are free floating; meaning they retain an individual value and will appreciate and depreciate against other currencies. Currencies are always listed in pairs as they need another currency to benchmark against.

Reasons for Trading Forex

Trading Forex has many purposes and you’ll be surprised of the many levels traded that impact you and you’re not even be aware of it. For every purchase you make, the contents, ingredients, by-products, parts or materials may not necessarily be from a domestic source. It could have been bought internationally and as such the exchange of foreign currency would have had to be taken place.

From a financial perspective, some people may trade the Forex market for profit. By taking a cross currency pair, they may exchange currency to a foreign designation hoping for domestic currency values to depreciate, thus when you convert it back you will receive more than you initially started.

For international importer or exporter of goods and services, there are great opportunities by having access to the international market. However, with fluctuating international currency rates, payment can sometimes be difficult. Initially companies make a sale for an agreed price, then on the day of payment the agreed value is significantly less than agreed to, due to a currency fluctuation is known as foreign exchange risk.

You will find all types of businesses, from large financial institutions to small retail freight forwarders will practice foreign exchange hedging. Simply put, these companies will put in place measure to ensure that their agreed payment value will represent the same value at the day of payment regardless of currency value fluctuations.

The Eight (8) Major Currencies

Internationally, there are eight (8) currencies that are traded more than other currencies. These are often referred to as Majors. These currencies are as follows:

USD – Unites States Dollar

JPY – Japanese Yen

GBP – British Pound

CAD – Canadian Dollar

EUR – European Currency Unit

CHF – Switzerland Dollar

AUD – Australian Dollar

NZD – New Zealand Dollar.

Certain parts of the world have part of their Saturday to trade, as it’s still Friday in other markets.
Financial institution in these countries may be dealing with the Forex market during their work hours, the Forex market is open and trading 24 hours, 5 days a week. For someone living in the East Coast of Australia, the market hours for the corresponding markets are outlined below:

New York session opens at 10:00pm and ends around 7:00am

Sydney session starts at 7:00am and ends around 4:00pm

Tokyo session begins at 9:00pm and ends around 6:00am

London opens at 5:00pm and ends around 2:00am.


Open FXTm Demo Account


blog30

Stochastic: What’s it Really Showing You?

Ever heard the expression “getting ahead of the curve?” In trading, this cliche perfectly reflects what every trader wishes they could consistently do. In addition to fundamental analysis, you might turn to charts to forecast price moves. A big part of using charts to make sense of the markets are indicators, but are they really any good? Many traders turn to the Stochastic indicator to check overbought or oversold levels, so just what insights does Stochastic analysis really offer, and how can you use these insights to determine when to open a position?


Here’s an overview of this popular indicator, why you might be struggling to use it, and some top tips that will help you avoid misinterpreting market moves.

Get free access to our trading platform and hundreds of indicators

Overbought and oversold

The terms overbought and oversold describe a period where there has been significant movement in price without much pullback or reversion. Simply put, a rise or fall that doesn’t deviate far from the trend line.

What goes up…! You know the saying. Price trends can’t last forever. They eventually reverse, and trading close to that point of reversal is one way you can maximize your profits. In traditional technical analysis, traders expect overbought or oversold currency pairs to reverse, but that’s not always the case and it can be quite an expensive realization. To constantly set your trades based on the Stochastic indicator will yield mixed and likely disappointing results.

How to read the Stochastic

If you’ve already signed up with Exness, then you have access to a trading platform and a risk-free demo account. This is the perfect way to get familiar with any of the free and paid indicators available. Open up your platform and go to the Navigator pane on the left. Scroll down and then drag the Stochastic folder to the chart. A section will appear below the price chart with two lines tracing along, above, and below a central range.

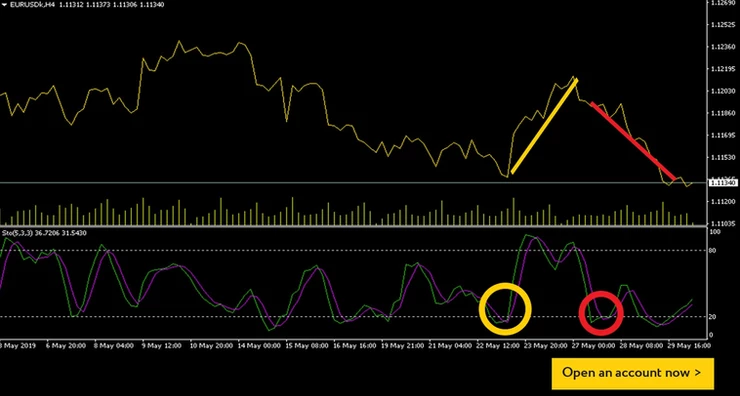
The concept is fairly simple. The lower horizontal line represents a value of 20. The upper horizontal line is 80. Whenever the tracing line breaches 80, it indicates a possible overbought status, and traders expect a price correction. Likewise, if the lines cross below the 20-mark, it signals a possible oversold status, and a reversal might be imminent.

In the above EURUSD example, a downtrend started on May 19 and crossed the 20-line on May 22 [yellow]. Traders using the Stochastic indicator would normally take this as a sign of overbought, and they would set a buy order with the expectations of a reversal. They would consequently be very pleased with the rise that followed. Just five days later, Stochastic indicated another oversold status [blue], but traders clicking the buy buttonprobably lost whatever profits they’d achieved the previous week. So, what’s going on?

Indicators are not fortune-tellers

FX News does not recommend using the Stochastic indicator as a stand-alone forecasting strategy. Indicators are best used to confirm theories, not to create them. Having said that, Stochastic is one of the best indicators a trader can use, but you might consider adding a little common sense to the mix. In the yellow example above, you can see that the price line and the Stochastic lines match rather well in the days preceding the oversold signal—and continue to do so after the fact. The perfect example of how a Stochastic indicator can forecast a reversal!

The blue example a few days later shows a clear divergence. The Stochastic line falls dramatically in a complete reversal from overbought to oversold, but the price line barely moves in comparison. Consider that a warning sign! Another common indicator is that the reversal usually comes when the rise or fall happens in a short period of time. Watch out for steep peaks and valleys that accompany the overbought/oversold range.

Top trading tips for advanced traders

Although we’ve used a price line to better illustrate the price moves in the chart image, FX News suggests using candlesticks when performing chart analysis. Moreover, Stochastic’s default %K period and slowing is set at 5,3,3, but cautious traders usually use higher numbers. On the top menu, go to Insert > Indicators > Oscillators > Stochastic Oscillator and set to 15,5,5. You can run both settings at the same time to see the differences. Certain settings may work better for certain pairs, so play around with the levels before committing to one.


Test Stochastic on your Exness trading platform

Open Exness Demo Account

Open Tickmill Demo Account

Open FXTm Demo Account