blog20

Why Is Liquidity So Important?

Have you ever run into the word “liquidity” while reading a financial report? It’s a term that gets thrown around by forex analysts all the time. Understanding liquidity can help you choose the right order types, which leverageto use, and how long you should keep your orders open. Soon you’ll understand the relationship between liquidity and volatility. Take your trading skills to the next level with this introduction to liquidity.

So what is forex liquidity and why should you care?

Liquidity is a measure of how easily a forex currency pair can be traded. Investments that can quickly be converted into cash are said to have high liquidity. The forex CFD market is liquid by nature, and traders can open and close trades in just a few clicks.


In contrast, real estate investment is much less liquid—especially during times of economic uncertainty. People selling a property may have a long wait until they can convert their investment back into cash, which is probably why forex has become so popular as an investment vehicle. Since liquidity indicates a safer or less volatile investment option, you might want to build your trading skills by limiting your trades to high liquidity currency pairs.

How can you find high liquidity currency pairs?
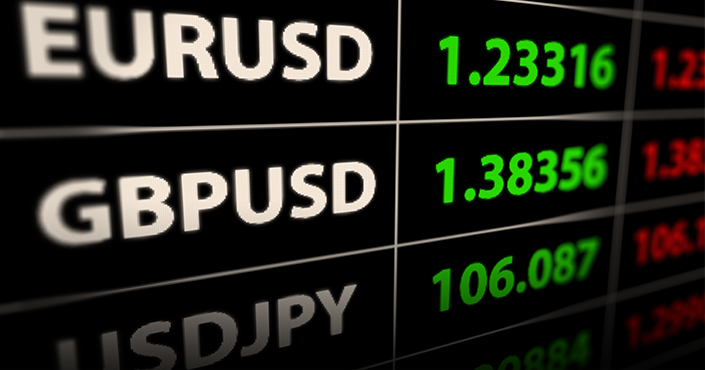
So you’re looking for a currency pair that offers the benefits of liquidity. Trading volume is a good indicator of liquidity. Trading volume refers to the amount and size of the orders being placed on a given currency pair. The more volume, the more stable the price line. The eight currency pairs with the highest volume and therefore liquidity are: EURUSD (Euro vs US dollar)

USDJPY (US dollar vs Japanese yen)

GBPUSD (British pound sterling vs US dollar)

AUDUSD (Australian dollar vs US dollar)

USDCAD (US dollar vs Canadian dollar)

USDCNH (US dollar vs Chinese renminbi)

USDCHF (US dollar vs Swiss franc)

EURGBP (Euro vs British pound sterling)

So now you know which pairs are favorably liquid, but why is this important? To better understand how liquidity influence prices, let’s scale everything down. Imagine that the liquidity for EURUSD comes from just 100 traders. One day, five people don’t make any orders. Trading volume shows a drop of around 5%. Prices will adjust, but nothing major will happen on the market. Now let’s consider an exotic currency pair like USDSEK. This time, only 10 traders generate the liquidity. One day, five traders don’t make an order. Trading volume drops by around 50%. Prices will adjust rapidly, and dangerous volatility will follow.

It all starts with volume

Let’s look at a real world example to demonstrate how volume changes the behaviour of the currency and price moves. Imagine three vehicles. A car, a bus, and a ship. The car represents those currency pairs that don’t get a lot of trading volume. Cars can be fast, light, and more maneuverable. The car can rapidly swerve or change direction, and even turn around at a moment’s notice. Because of the  limited volume, you can expect a wild ride when trading the “smaller” currency pairs. The bus is a heavier vehicle and much less maneuverable, and it carries a much higher volume.  It’s not the most popular choice for traders, but the higher volume still offers a slower, less-volatile ride.

The ship is by far the slowest at making course changes. Ships have massive volume compared to other vehicles. These “bigger” currency pairs are traded by many, enjoy endless liquidity, and make for a much smoother ride.The eight listed currency pairs above could be considered “ships”. Major currency pairs have massive volumes, and a change in direction is usually slow. The charts appear smoother with fewer spikes. Simply put, the more liquidity, the more volume, the slower the price change. The exception to this is when something “big” happens. When a nation makes a political or economiceconomic announcement that traders perceive as “bad for business”, investors can make the same conclusion at the same time and abandon the vehicle, destabilizing it as they go..

Example: When the UK announced Brexit in 2016, GBP investors everywhere probably came to the conclusion that a non-EU destination would be economic suicide. GBP investors started jumping ship, and sterling started sinking. Some traders stayed loyal and hopeful, and they are now battling a stormy or volatile transition.

Top tip for high liquidity traders

Trading high liquidity pairs means you can use wider ‘Take Profit’ and ‘Stop Loss’ settings. You might also consider a higher leverage depending on how stable the currency pair is. When checking for price reversals, sharp moves can be misleading. Make sure there’s plenty of volume behind the change. Whichever currency pairs you choose to trade, always take liquidity into consideration before setting leverage and stop orders.

Open Exness Demo Account

Open FXTm Demo Account


blog21

Hedging vs Stop Loss

It’s not so hard to find an attractive currency pair to trade after spending an hour or two on your technical and fundamental analysis, but how can you protect your trading account from those unexpected and rapid crashes that happen from time to time?

It’s not so hard to find an attractive currency pair to trade after spending an hour or two on your technical and fundamental analysis, but how can you protect your trading account from those unexpected and rapid crashes that happen from time to time?

If you’ve been using Stop Loss, then there’s a chance that you may have missed a rally or two; as a result you may have ended up losing when you could potentially have seen some significant gains. Read on to discover whether there’s an alternative to Stop Loss that will ensure your orders don’t get closed prematurely, keeping you in with a chance to take full advantage of the next big rally. But first, let’s look at how Stop Loss actually works.

How Stop Loss works

If you’re trading a volatile currency, setting a Stop Loss just seems like the smart thing to do. After all, the forex market never sleeps, and anything can happen while you’re away from your trading platform. Stop Loss is a pending order, that will automatically activate when market conditions reach or match the level you specified, but this type of order has a weak point that many new traders discover the hard way.

Let’s use some simple numbers to explain the problem.

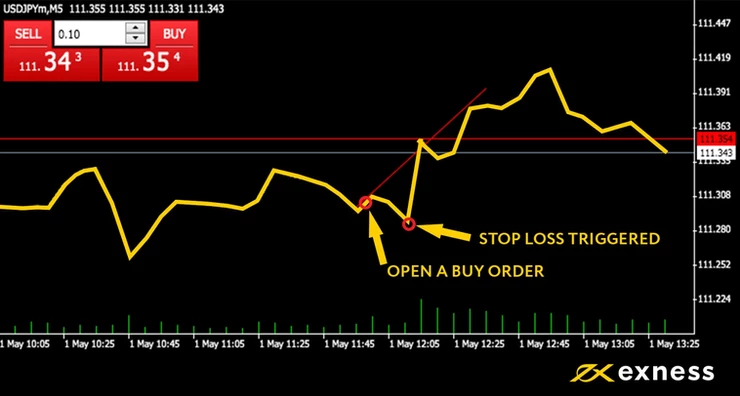
A USDJPY Buy order at 111.300

Take Profit at 111.400

Stop Loss at 111.280

If the price falls to 111.280, your Stop Loss will protect you from losing more money as it will automatically close your order. But what happens if the price bounces back up to 111.300 or above? Huge disappointment! Have you ever gone back to your trading platform to check your order after a few hours, saw that the price was on the rise, but then realised that your order had already been closed by a brief downward spike? Such price moves are often a source of frustration and complaint, especially with volatile pairs or during economic releases. Thankfully, there is an alternative to Stop Loss.

How hedging solves the problem

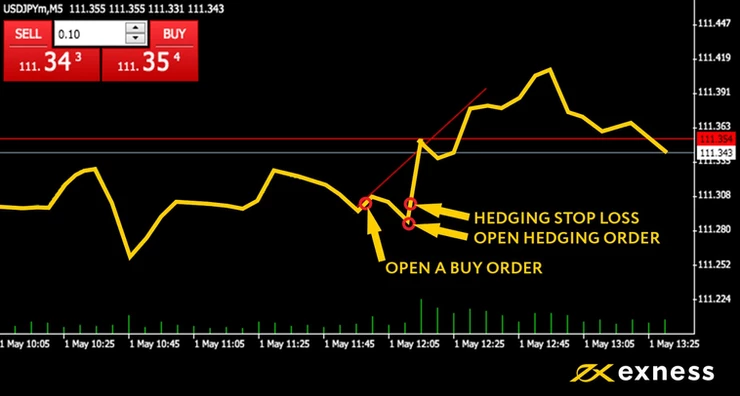
Consider setting a pending hedging order instead of a Stop Loss. Hedging also offers protection from huge losses, but it won’t close your order. Let’s use the same USDJPY order to see how a pending hedging order performs.

Buy order at 111.300

Take Profit at 111.500

Pending Sell order to activate if the price hits $111.280

If the price falls to $111.280, the hedging order activates. From that point, the hedging Sell order will offset any losses to the original Buy order. Your account will not suffer, no matter how low the price goes. And, your Buyorder is still active if a rally is just around the corner.

When to stop the hedging order

If the price goes down, bounces back, and eventually moves into a rally, then your Buy order will profit as you intended, but your hedging Sell order is losing now, and eating away at your Buy order profit. What can you do?

Consider setting a Stop Loss for your hedging Sell order at the entry point of the original Buy order. This way, when the rally kicks off, the hedging Sell order will be closed and you’ll enjoy all the benefits of the rally. You’ll take a slight loss from your hedging Sell order, but at least your Buy order remains active and ready to reap the rewards of the rally. Some might say a fair tradeoff worthy of the fuss.

Word to the wise

Play around with the Exness demo account to better understand this strategy. Only after you get familiar with the mechanics of hedging should you consider trying it for real. With such protection in place, you’ll be able to use a higher leverage, even if market volatility is rampant.

Using hedging instead of Stop Loss is not a bulletproof solution. If, in the example we used above, the price falls then continues to fall, you cannot profit, and you’ll end up closing both orders with a small loss. Using such trading tools can make a huge difference to your trading performance. The little things make a big difference and often separate the beginners from the professionals.

Open Exness Demo Account

Open FXTm Demo Account


blog25

Indicators 101: How to Use Fibonacci Retracement

In this article, I’m going to show you how to apply Fibonacci retracement levels to a chart and what information it provides. Remember, indicators “indicate” possible price moves and entry-exit points. You’ll still need to interpret the data for yourself, so I’ll show you how to do that too.


What is Fibonacci retracement

Let’s break down the words Fibonacci and retracement to better understand what this tool does.

Fibonacci was an Italian mathematician who discovered a sequence of numbers that occurs in nature. This infinite sequence is created by adding together the preceding two numbers on the list to create the next number. For example: 0, 1, 1, 2, 3, 5, 8, 13, 21, etc.

Retracement refers to how a price trend can sometimes temporarily fall back before continuing in the direction of the trend.

Why is Fibonacci retracing so useful?

The Fibonacci Retracement tool helps traders identify levels for setting Buy Stop Limits or Sell Stop Limits that can activate orders whenever a price retracement occurs. The indicator lines also help when searching for a trading entry point level on a trending price move.

How to set up Fibonacci levels

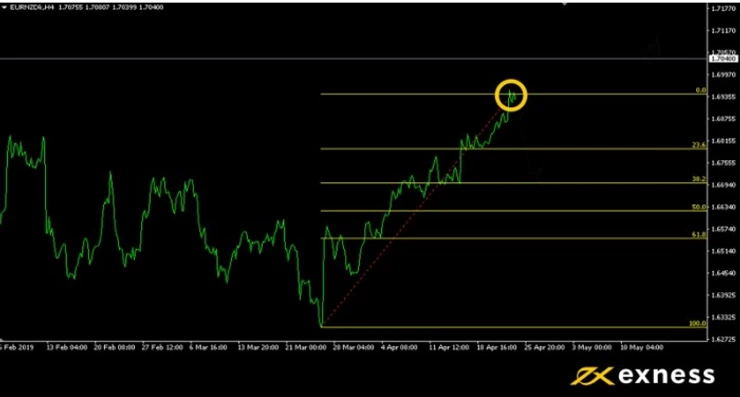
Open your Exness demo account and let’s apply the Fibonacci tool to a chart. EURGBP often displays volatility. It’s a perfect pair to demonstrate how the Fibonacci tool can help you set a more profitable order prior to a price retracement. On the top menu of your trading platform, set the timeframe to H4 (4 hourly) and display the price as a line.

Go to the top menu >> Insert >> Fibonacci >> Retracement

On the chart, draw a line at the start of a trend to the point of reversal by holding down the left mouse button until you get to the break.

If a retracement occurs, how low will it go? That’s where the yellow lines or levels can help with your forecasting. The displayed Fibonacci levels or lines offer several entry points. Assuming the trend continues, the higher the line value the greater the profit. These entry points levels can be customized, but most traders don’t mess with the defaults. So which level should you choose for your entry point?

Fibonacci retracement entry points

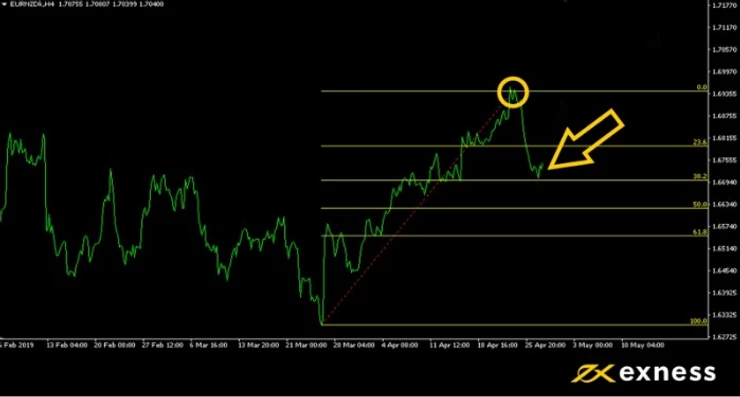
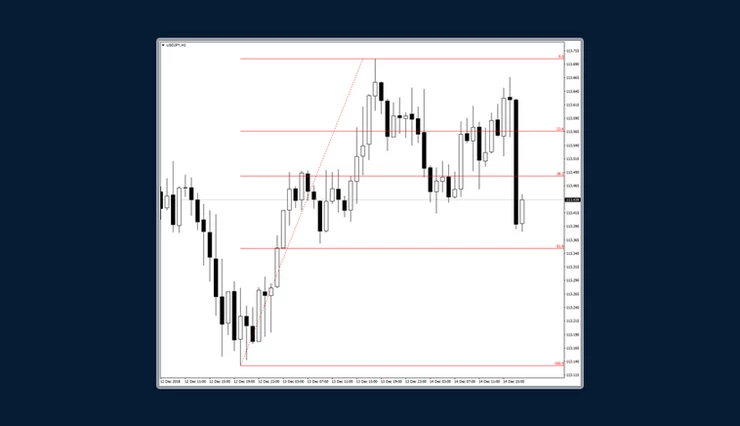
In the example above, EURNZD started a bull run at 4:00 pm on March 26. A retracement began four hours later. The Fibonacci tool displays six levels ranging from 0.0 (no retracement) to 100.0 (full reversal). Choosing the right level is ultimately your decision, but the Fibonacci levels work as an effective guideline or benchmark. Just remember that an indicator is not a time machine and market prices don’t always follow the mathematical rules.

23.6: A small move that happens all the time and offers limited value or improved profitability.

38.2: An accurate forecast at this level creates attractive profits, and the likelihood of it occurring remains quite high.

50.0: Half retracement. Not a tall order by any means, but the improvement to your profit ratio improves significantly—compared to opening a position on the high.

61.8: Entering the realm of more and more unlikely. To catch such a reversal in the middle of a rally is a long shot, but highly profitable when it happens.

Most conservative traders will probably set entry levels between 23.6 and 50.0 but that number will rise as your knowledge and experience grows.

In the example above, the reversal dropped to the 38.2 mark and then continued to rally well beyond the price at the time of drawing the Fibonacci lines.

Top Fibonacci trading tip

Remember, market prices won’t always fit in with Fibonacci levels so perfectly. Many unexpected changes can and will affect your orders if you trade on a daily basis. Most traders agree that the longer the timeframe and greater the price difference, the more accurate the forecast.

Trading indicator tools can be likened to comments on Amazon. You’ll get better results in the long-term if you take more than one into consideration, so work hard and use other indicators together with fundamental analysis.

Test the Fibonacci trading tool on a real or demo account


Open Exness Demo Account

Open Alpari Demo Account


The Breakout Strategy

The Breakout Str

News Release Trading Strategy

News traders trade off economic news release. The Forex market is particularly reactive to economic news, in particular, interest rate news from the G8 countries, as well as unemployment news for each corresponding country. News traders will have to bear in mind that the Forex market movements have already taken in to consideration existing and expected economic news. The sharp movements you see due to economic news are corrections due to unexpected news, either better than expected or worse than expected.

Another consideration to take to heart for potential news traders is that during negative sentiment news reports, currency movements generally head towards lower yielding and perceived safer currencies; USD and JPY in particular.

A good grasp of economics is generally recommended for traders wishing to start news releasing trading.

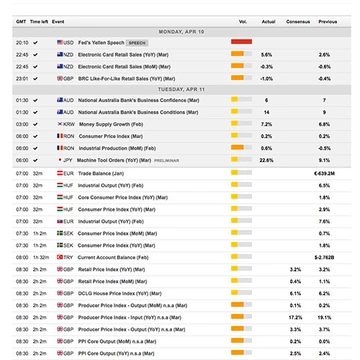
An economic news calendar is highly recommended. Forex Economic calendars show the release date for important economic news such as non-farm payroll, GDP figures and interest rate news. Below is an example of what an economic calendar shows:

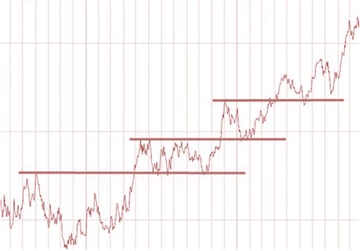
ategy is the break out of a sideways trend. Usually, momentum is greatest on breakout points. A lot of traders take advantage of the breakout strategy when sideways moving prices break the upper or lower limits. Below represents a few breakouts following some periods of sideways tending.

blog26

A Trader’s Guide to Closing Orders

This article is dedicated to those of you who already have a trading account but haven’t managed to establish a trading routine yet. There’s so much to learn, and it can sometimes feel overwhelming. There are tutorials that show you how to use the trading platforms, and economic news releases that can help you find a currency pair to trade. What’s hard to find is an explanation of how high you should set your profit goals. Even more elusive is a clear rule for how long you should keep your orders open. Here’s a simple strategy for setting your exit points based on price history instead of profits or losses.

Stopping orders at the right time

If you’ve built your trading confidence on the Exness demo account, then you’ve probably seen some sizable profits and losses. Keep in mind that your trading goal is not to be consistently profitable—that’s not a realistic option. Keeping the total profits above the total losses is something full-time traders usually aim for, and there are many techniques that can help with that. Of course, that’s easier said than done, but there are some areas that more inexperienced traders often overlook. Let’s say, you’ve got an open order on your trading platform. You’re hopefully thinking of setting your Stop Loss and Take Profit levels, but what you might not be sure about is the exit points. This is where the chart timeframes can help. Firstly, just how long are you planning to keep your orders open? It’s the first thing to consider. If you place an EURUSD order for the day, your Take Profit and Stop Loss setting could be very different from an intended month-long order. Here’s why.

Timeframe analysis

Timeframe analysis is primarily used for trend trading. For example, if you are thinking of trading XAUUSD, you might consider sticking to longer timeframes for analysis and speculation. This is because gold has a slow and slightly more predictable rise over the course of each year. It is considered by many traders as a long-term investment option. When you set your exit points, set your timeframe to show the big picture. If you plan to close the order in a month, what were the prices one month ago? Apply this logic to all your trades, then compare the historic price level with the current level of resistance.  In contrast, if you are day trading, don’t expect the prices to go far beyond what you’ve seen over the last 24-hours. Whatever levels prices reached last year shouldn’t influence your short-term orders.

Top trading tip

Ideally, you are looking for trends that are consistent on multiple timeframes. If, for example, both short-term and long-term trends have bullish indicators, a Buy order could be a strong option. If the short-term trend shows bearish tendencies within a long-term uptrend, caution is advised.

Reading price charts is not something that can be learned in a day. Like driving a car, you need to spend time practicing before you take to the highway. Make time to check the timeframes of multiple currency pairs each day. Look at the time period you intend to trade and take detailed notes on price history. How much movement occurred over how much time? Make conclusions and write down why you think a Buy or Sell order is favorable, then go back to previous conclusions and see if you were right or wrong.

As you learn from your mistakes, your perceptions of the market’s ebb and flow will change. Remember, the goal of this strategy is to have more profits than losses. You’ll never win them all, but there’s always room for improvement.

Test and develop your analytical skills risk-free on a demo account

Open Exness Demo Account

Open Alpari Demo Account

Open Errante Demo Account

blog3-1

Retracement in Forex Trading

Learn Forex Trading

Author: Andreas Thalassinos

Leonardo Fibonacci, an Italian mathematician from Pisa, is credited with introducing the Hindu-Arabic numeral system to Europe during the Middle Ages. In his book, Liber Abaci or ‘Book of Calculation’, he also introduced an influential sequence of figures which have come to be known as the Fibonacci numbers.

The relationship between the numbers in this sequence (i.e. the ratio) is not just interesting on a theoretical level. It appears frequently around us in the physical world and is integral for maintaining balance in nature and architecture. It is also important in the financial markets; many traders use Fibonacci ratios to calculate support and resistance levels in their forex trading strategies.

What is the Fibonacci sequence?

Each number in the Fibonacci sequence is calculated by adding together the two previous numbers.

1 1 2 3 5 8 13 21 34 55 89 144 233 377 …and so on to infinity

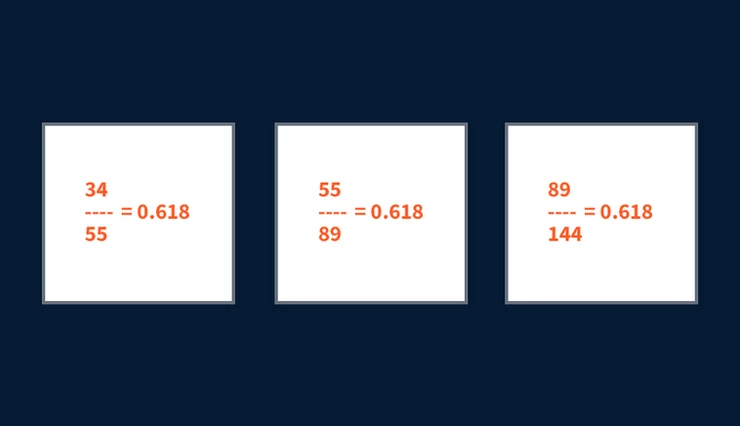
What is significant about this pattern, however, is that the ratio of any number to the next one in the sequence tends to be 0.618.

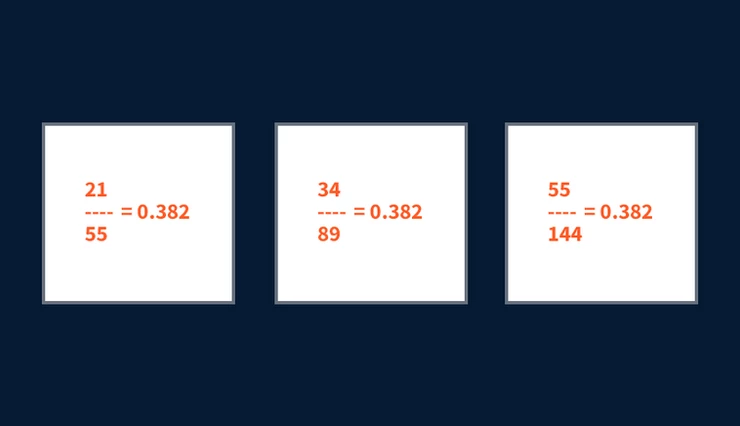
Furthermore, the ratio of any number to the number two places ahead in the sequence is always 0.382.


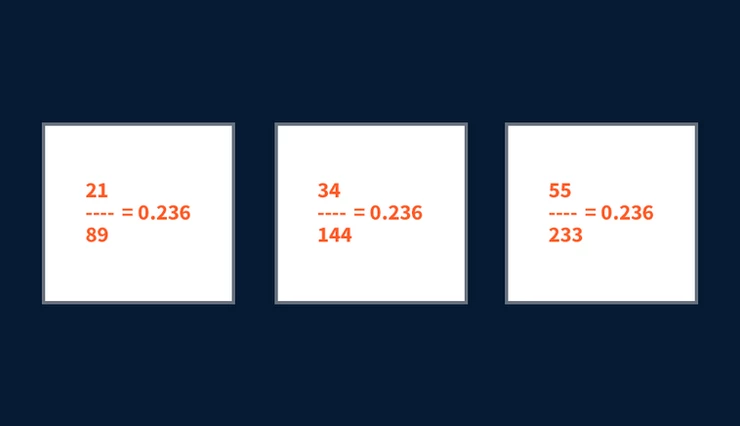
Similarly, the ratio of any number to the number three places ahead tends to be 0.236.


These ratios are commonly known as Fibonacci ratios.

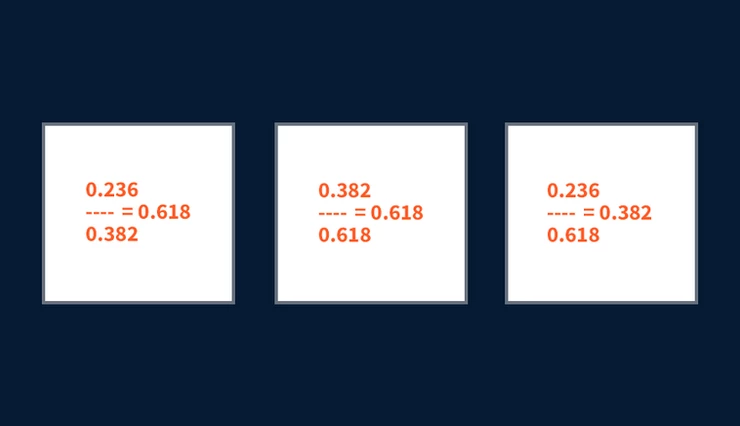
Dividing these Fibonacci ratios will result in either 0.618 or 0.382:

How Fibonacci retracement works

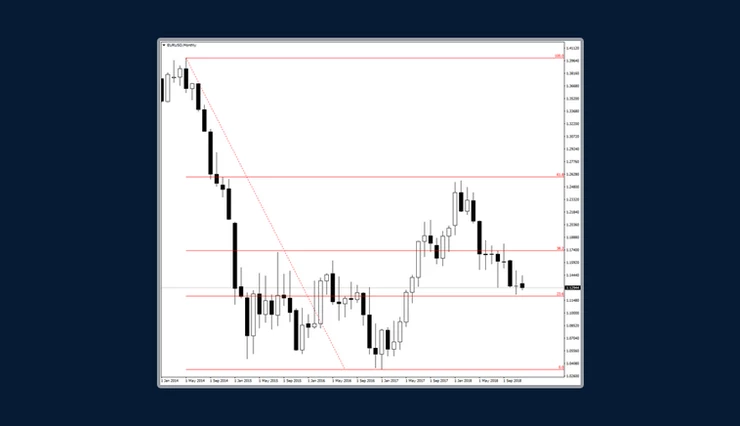
In trading, these ratios are also known as retracement levels. Traders wait for prices to approach these Fibonacci levels and act according to their strategy. Usually, they look for a reversal signal on these widely watched retracement levels before opening their positions. The most commonly used of the three levels is the 0.618 – the inverse of the golden ratio (1.618), denoted in mathematics by the Greek letter φ.

How to draw Fibonacci retracement levels

Drawing Fibonacci retracement levels is a simple three-step process:

In an uptrend:

Step 1 – Identify the direction of the market: uptrendStep 2 – Attach the Fibonacci retracement tool on the bottom and drag it to the right, all the way to the topStep 3 – Monitor the three potential support levels: 0.236, 0.382 and 0.618

In a downtrend:

Step 1 – Identify the direction of the market: downtrendStep 2 – Attach the Fibonacci retracement tool on the top and drag it to the right, all the way to the bottomStep 3 – Monitor the three potential resistance levels: 0.236, 0.382 and 0.618

Of course, it is more reliable to look for a confluence of signals (i.e. more reasons to take action on a position). Don’t fall into the trap of assuming that just because the price reached a Fibonacci level the market will automatically reverse.

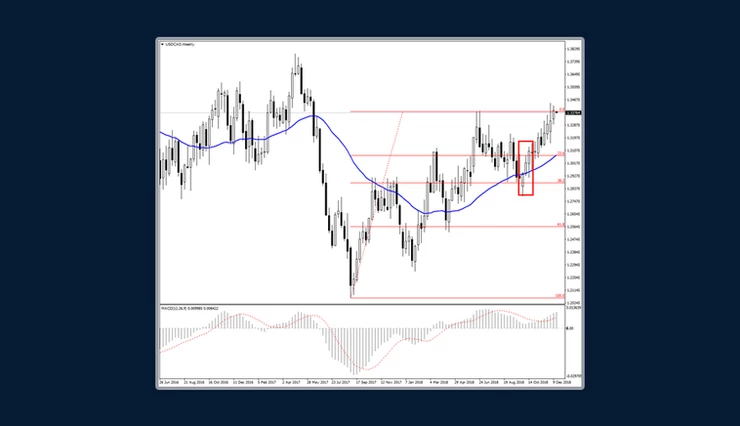
Combine Fibonacci levels with Japanese Candlestick patterns, Oscillators and Indicators for a stronger signal. As you can see in the chart below, the “Three White Soldiers” pattern is confirmed by the fact that prices are trading above the Moving Average line, and additionally that the MACD (Moving Average/Convergence Divergence) is above the zero line.

Trading using Fibonacci retracements

Every trader, especially beginners, dreams of mastering the Fibonacci theory. A lot of traders use it to identify potential support and resistance levels on a price chart which suggests reversal is likely. Many enter the market just because the price has reached one of the Fibonacci ratios on the chart. That is not enough! It is better to look for more signals before entering the market, such as reversal Japanese Candlestick formations or Oscillators crossing the base line or even a Moving Average confirming your decision.


Learn to trade with FXTM

Discover how to make the right trading decisions for your style and goals with our comprehensive range of educational resources. open a demo account and try your skill!