blog13

How To Develop Your First Forex Trading Plan

The ability to create and follow a forex trading plan is one of the most important things a forex trader must learn. Many new forex traders fall into the trap of either not creating a plan or failing to stick to the ones they do create. Doing either is a big mistake and leads to irrational, hasty, and emotional decision-making (very bad things when it comes to forex).

The process of creating a forex trading plan will help you understand your trading strategy thoroughly and serve as a blueprint for making trading decisions. If you design your trading plan correctly, the unexpected should not be an issue  – you should have already thought out and have a course of action for just about anything that might occur.

So how do you create a plan? In this post, we’ll take you through it from start to finish.

Oh, one thing to note before we go any further:  

Having a trading plan alone is not enough. You should also be keeping a detailed trading journal to help you keep track of how consistently you are following your trading plan. In the following article, we’ll take you through the steps of creating your first plan.

1. Determine What Kind Of Trader You Are – And How Many Trades You Should Make

The first step to creating a forex trading plan is to determine what kind of trader you are based on the frequency of your trades and the duration over which your trades run. If you are a day trader whose trading style revolves around scalping, then you should plot your trading plan with a 24-hour timeframe. On the other hand, if you are a swing trader whose trades usually span several days, you should use a week as your planning horizon. To determine the number of trades that you should make within your trading horizon, you should add up all your winning trades  over your chosen time period and then multiply them by 1.2. For example, if you make 15 trades a week and only five are winning trades, you should not make more than six or seven trades each week. The idea is to increase your win rate and your chances of being an effective forex trader.

2. Maximize Your Opportunities

By limiting the number of trades that you make on a daily basis you limit your opportunities in the markets. This is not a bad thing. Limiting the number of trades you make on a daily basis should allow you to focus on finding the best trade setups that match your trading plan. By making fewer trades, you will be able to focus more on analyzing your trades and on making trades that have a beneficial risk/reward ratio.


3. Eliminate Emotional Trading

As a beginner forex trader, you should strive to avoid making trades based on your emotions by always sticking to your predetermined trading parameters. By limiting the number of trades you make each day, you can more easily avoid making ‘revenge’ trades. This can happen after you make a bad trade when you make further trades in an attempt to make up your losses. Many new traders succumb to the urge to make emotional rebalancing trades in order to make up for their losing trades. Most emotional trades usually carry higher risk because their main objective is to recoup the losses on a previous trade, which might be significant.

4. Set Entry Rules

Most beginner traders start out being very excited about the movements of the currency pairs they want to trade and will typically open new trades based on an instinct alone. This is not the best way to trade as, in many cases, traders end up with open positions that they have not fully thought through or researched. Your trading plan should clearly describe the signals that you will look for before opening a trade. You should include the different parameters that the indicators you are using must meet in order for you to enter into a trade. The more detailed your plan is, the better your results will be. Having a clearly defined entry rules will ensure that you remain disciplined in all your trading activities.


5. Set Exit Rules

Having exit rules is just as important as having entry rules because having predetermined exit signals helps you maximize the potential gains on your trades while limiting your losses. Your exit rules should be aligned with the maximum risk you are willing to take on each trade as well as the profit potential of each trade. For example, a trader with a 1:3 risk/reward ratio would be willing to risk USD 50 dollars for a profit of USD 150 on each trade. This means that the trader should exit a losing trade once their losses reach USD 50 and should look to exit a profitable trade with a  USD 150 profit.

6. Set Stop-Loss And Take-Profit Levels


Now that you know the importance of setting entry and exit rules, stop-loss and take-profit levels are  next. It is crucial that you set a stop-loss level on every trade that you make in order to limit your potential losses one every trade. You should think this through ahead of time and should tie your stop loss to the percentage of your trading account that you are willing to risk.


Conclusion

Now that you have a good understanding of how to create your trading plan, you should get to work creating one using a free Demo trading account The Demo account will allow you to test and refine your current trading plan on either our MT4 of MT5 platforms and will enable you to pinpoint weaknesses in your plan. Once you are satisfied that your plan works in you Demo account, you can consider using it in you live account. 

Open Exness Demo Account

Open FXTm Demo Account


blog12

Trading Strategy: Forget Price, Try Trading Volume

Are you ignoring the volume bars at the bottom of your price chart? It’s not unusual. Loads of traders prefer to track prices or

f

s when choosing a currency pair. At first glance, volume doesn’t seem to be the most powerful indicator, but there’s more to trading volume than meets the eye.


The volume section of your trading platform shows the total lots of the selected currency pair being bought or sold. For example, whenever heavyweight investors start opening huge trading contracts, trading volume quickly rises. Moreover, if the world’s media channels suddenly popularize a particular currency pair, trading volume tends to rise shortly after as thousands of traders open orders. In other words, trading volume is—among other things—a popularity meter. But how is that useful to you?

Volume and leverage

Before we even think about placing an order, we should first consider how volume relates to leverage. “Why leverage?” you may ask. What could volume and leverage have in common? Leverage is an important choice when you first go through the signup process. With Exness, you can open and manage multiple trading accounts from one convenient Personal Area. Each account can have a different leverage setting, which is very useful if you wish to trade both high volatility and low volatility pairs. The rule of leverage is simple and will give your trading strategy a solid foundation. low trading volume = low liquidity = high volatility = lower leverage

high trading volume = high liquidity = low volatility = higher leverage

A highly volatile currency pair could create huge profits when combined with high leverage, but such fragile orders tend to ‘Stop Out’ underfunded trading accounts in minutes when massive price fluctuations occur. Not recommended! Instead, try comparing the trading volumes of your favorite pairs with the major and minor currencies. If your pair is experiencing lower volume, then you might want to use a trading account with a lower leverage setting. Checking the volume of your preferred currency pairs could save you a lot of disappointment.

Strong price vs high price

Volume can be used to measure the ‘strength’ of a price shift, which answers a common question every trader asks themselves on a daily basis. “Is this price shift a coming reversal or just another bump in the road?”

Let’s consider a currency in a long-term downtrend. One day, the price begins to rise. Is this a breakout in the making, or just another fluctuation? A change in trend depends on many factors, but the first place to start checking is the trading volume. If the trading volume is low at the time of a price increase, then the market move is probably just a hiccup and the downtrend will return with a vengeance.

On the other hand, if the volume has been higher than usual, then you might be seeing the early stages of a price reversal. In a nutshell, low volume direction changes don’t stick. There are always exceptions to every trading strategy, but spotting a weak reversal is a very strong indicator.

How to test the trading strategy

Try opening up your trading platform and targeting a currency pair on the Market Watch list. Look back over the last few weeks until you find a significant fall in the trading volume, then check what happened to the price shortly after. Match your leverage to the average volume, then wait for the next possible breakout. If the price is reversing and the volume is rising, then the pair could be an attractive trading opportunity that deserves investigation or investment.


Open Exness Demo Account

Open FXTm Demo Account


blog9

3 Ways MetaTrader 5 Has Improved On MetaTrader 4

How can you take something beloved by a global community and make it better? With MetaTrader4, MetaQuotes built a trading platform that has become the standard of retail forex traders around the world.

With the global trading community demanding more customization, greater control, and more capabilities, MetaTrader have gone one better and created a next-generation platform called MetaTrader 5.  

Available with Exness on Demo accounts, we wanted to give you a sneak peek at the features that make MetaTrader 5 special.

Customizable Approach To Trading: New Features In MT5

There’s nothing more frustrating than not being able to get your chart set up the way you want it, or not being able to place your order exactly the way you want it to be placed.

With MT5 a lot of these frustrations have been eliminated.

Timeframes. MetaTrader 5 offers 21 different timeframes, vs just nine in MetaTrader 4. This means you can get exactly the right chart for your trading strategy, rather than having to make do on MetaTrader 4.

Order types. In MetaTrader 5, you can access two additional pending order types, “buy stop limit” and “sell stop limit”. You can find out more about these in our blog post specifically on the subject of pending order types.

What’s more, with MetaTrader 5 subtle changes in the “navigator” pane mean that you can find what you want, when you want, at a far greater speed.

Analysis

The changes to MetaTrader 5 go beyond simple user experience. Improvements to analytics, testing, and tool building demonstrate how much MetaTrader 5 has been created with the experienced trader in mind.

Fundamental analysis. With MetaTrader 5, traders can benefit from access to economic and industrial news right within their terminal, as well as enjoying a economic calendar highlighting upcoming announcements from around the world. These new tools come bundled with MetaTrader 5 right from launch.Technical analysis. With MetaTrader 5, right out of the box traders get access to 38 indicators and 44 analytical objects, versus 30 indicators and 33 analytical objects in MT4, with a vast number of additional solutions available for free via Code Base or for a price from the new Market feature.

Expert Advisors

EAs were always remarkably valuable in MT4 because they allowed traders to automate some or all of their decision-making to a complex algorithm that could analyse trends and place orders.

In MT5 this functionality is further increased, made possible by the highly advanced MQL5 programming language.

Programming. MT5 is designed from the ground up to empower experienced traders to build powerful EAs themselves. With a programming language similar to C++, it is easy for traders to get their heads around the process and start building. At the same time, less experienced will benefit from access to better quality EAs, which they can test and apply.Market. Even more exciting for experienced traders is the new Market feature, which allows traders who have programmed EAs themselves to make money by selling them to the community, right from the terminal.

Using MetaTrader 5 With Exness

It couldn’t be easier to try out the MetaTrader 5 platform for yourself with Exness. Here’s a simple guide the getting started:

Open an MetaTrader 5 trial or MetaTrader 5 real account from your Personal AreaDownload the MetaTrader 5 desktop or mobile terminal from the Exness downloads pageEnter your account details to log in

What’s more, MT5 accounts can now be used with the WebTerminal. Accessible right from your personal area in the left-hand menu, this means you can start trading on MetaTrader 5 without anything to download!

Try it for yourself.

Open an EXNESS MT5 account today.


Open an FXTM MT5 account today.

blog7

How To Reduce Forex Risk Through Hedging

Author:Exness Broker

Hedging is a common strategy used by forex traders to limit the risks associated with some of their trades. Forex hedging strategies rely on positions opened by a trader in order to reduce their overall exposure to changes in prices of a given currency pair.

Although hedging strategies are usually employed to limit a trader’s risk, it is important to incorporate technical and fundamental analysis within any hedging strategy in order to make it effective. The best forex hedging strategies limit risk, but also take a cut of your profits. You can think of this as taking an insurance premium on your positions.

Hedgers Vs. Speculators A hedger’s primary motivation is to reduce the risks associated with price movements in the instruments they trade. On the other hand, a speculator takes positions in a given market with the primary motivation of making a profit from future price movements.

Hedging is largely a way of buying insurance against price movements that do not favor your current and future positions. As we’ll see, forex traders also use hedging as a way to generate potential profits.

Achieving Market-Neutral Positions Achieving market-neutral positions through hedging usually involves identifying two currency pairs that are positively correlated, and initiating opposite trades in each of the currency pairs. Examples of positively correlated currency pairs include the EURUSD and GBPUSD, as well as the AUDUSD and the NZDUSD.

The most important aspect of hedging is to choose two correlated pairs that move somewhat asymmetrically to each other. For example, when trading the AUDUSD and NZDUSD currency pairs, you take opposite positions across the two pairs as a hedging strategy. In this instance, as the NZD is a less volatile currency, you have to compensate with a larger trade size as compared to the opposite AUD trade.

A Word Of Caution There are some retail traders who use hedging strategies to minimize existing loses on a losing trade. For example, if a trader has entered into a losing EURUSD long trade, they might decide to open a short EURJPY trade in order to mitigate their losses by booking some gains from the short trade.However, opening a hedging trade to minimize the losses from a losing trade is very risky given that such a trader could ends up compounding the risks associated with their trades. In the above example, by opening a EURJPY short trade, the trader is now exposed to fluctuations in JPY, USD and EUR.

Hedging Strategies On The Same Currency Pair Hedging on the same currency pair is an advanced strategy based on executing different types of trades on the same pair using different lot sizes to minimize losses and maximize profits. This strategy is best suited for intermediate and advanced forex traders.Here’s an example of such a strategy. A trader buys 0.1 lots of the EURUSD currency pair at 1.2130, after which they quickly opens a sell stop order of 0.3 lots on the same pair at 1.2100. This would protect them regardless of the direction in which the currency pair moves.

In this instance, if the currency pair does not rally to the initial profit target of 1.2160 for a 30 pip gain, but instead declines to a low of 1.2070, they would still profit. This is because the sell stop order becomes an active sell order once the pair breaches the 1.2100 level.

Conclusion This article provides a brief overview of the different hedging strategies that you can use when trading the forex markets. Hedging is an essential skill to learn in order to limit the risks associated with your open positions. Through a Demo acDemo account, you can test these strategies before applying them to live trades.

blog25

Indicators 101: How to Use Fibonacci Retracement

In this article, I’m going to show you how to apply Fibonacci retracement levels to a chart and what information it provides. Remember, indicators “indicate” possible price moves and entry-exit points. You’ll still need to interpret the data for yourself, so I’ll show you how to do that too.


What is Fibonacci retracement

Let’s break down the words Fibonacci and retracement to better understand what this tool does.

Fibonacci was an Italian mathematician who discovered a sequence of numbers that occurs in nature. This infinite sequence is created by adding together the preceding two numbers on the list to create the next number. For example: 0, 1, 1, 2, 3, 5, 8, 13, 21, etc.

Retracement refers to how a price trend can sometimes temporarily fall back before continuing in the direction of the trend.

Why is Fibonacci retracing so useful?

The Fibonacci Retracement tool helps traders identify levels for setting Buy Stop Limits or Sell Stop Limits that can activate orders whenever a price retracement occurs. The indicator lines also help when searching for a trading entry point level on a trending price move.

How to set up Fibonacci levels

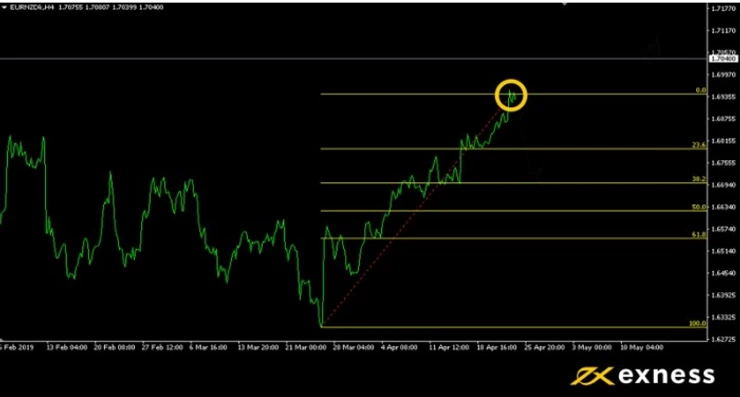
Open your Exness demo account and let’s apply the Fibonacci tool to a chart. EURGBP often displays volatility. It’s a perfect pair to demonstrate how the Fibonacci tool can help you set a more profitable order prior to a price retracement. On the top menu of your trading platform, set the timeframe to H4 (4 hourly) and display the price as a line.

Go to the top menu >> Insert >> Fibonacci >> Retracement

On the chart, draw a line at the start of a trend to the point of reversal by holding down the left mouse button until you get to the break.

If a retracement occurs, how low will it go? That’s where the yellow lines or levels can help with your forecasting. The displayed Fibonacci levels or lines offer several entry points. Assuming the trend continues, the higher the line value the greater the profit. These entry points levels can be customized, but most traders don’t mess with the defaults. So which level should you choose for your entry point?

Fibonacci retracement entry points

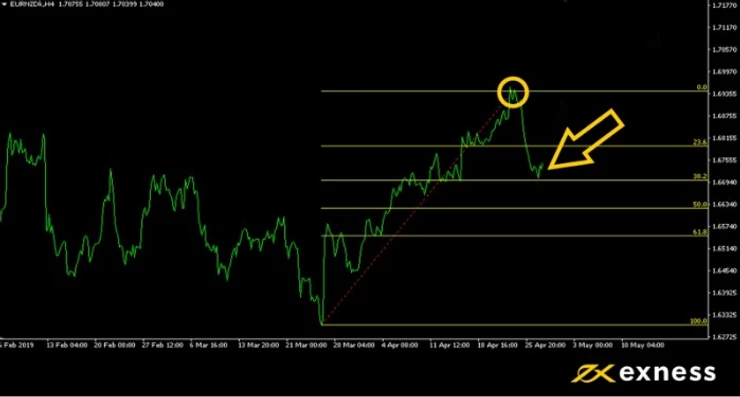
In the example above, EURNZD started a bull run at 4:00 pm on March 26. A retracement began four hours later. The Fibonacci tool displays six levels ranging from 0.0 (no retracement) to 100.0 (full reversal). Choosing the right level is ultimately your decision, but the Fibonacci levels work as an effective guideline or benchmark. Just remember that an indicator is not a time machine and market prices don’t always follow the mathematical rules.

23.6: A small move that happens all the time and offers limited value or improved profitability.

38.2: An accurate forecast at this level creates attractive profits, and the likelihood of it occurring remains quite high.

50.0: Half retracement. Not a tall order by any means, but the improvement to your profit ratio improves significantly—compared to opening a position on the high.

61.8: Entering the realm of more and more unlikely. To catch such a reversal in the middle of a rally is a long shot, but highly profitable when it happens.

Most conservative traders will probably set entry levels between 23.6 and 50.0 but that number will rise as your knowledge and experience grows.

In the example above, the reversal dropped to the 38.2 mark and then continued to rally well beyond the price at the time of drawing the Fibonacci lines.

Top Fibonacci trading tip

Remember, market prices won’t always fit in with Fibonacci levels so perfectly. Many unexpected changes can and will affect your orders if you trade on a daily basis. Most traders agree that the longer the timeframe and greater the price difference, the more accurate the forecast.

Trading indicator tools can be likened to comments on Amazon. You’ll get better results in the long-term if you take more than one into consideration, so work hard and use other indicators together with fundamental analysis.

Test the Fibonacci trading tool on a real or demo account


Open Exness Demo Account

Open Alpari Demo Account


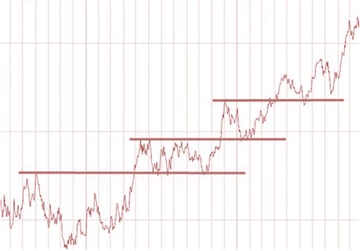
The Breakout Strategy

The Breakout Str

News Release Trading Strategy

News traders trade off economic news release. The Forex market is particularly reactive to economic news, in particular, interest rate news from the G8 countries, as well as unemployment news for each corresponding country. News traders will have to bear in mind that the Forex market movements have already taken in to consideration existing and expected economic news. The sharp movements you see due to economic news are corrections due to unexpected news, either better than expected or worse than expected.

Another consideration to take to heart for potential news traders is that during negative sentiment news reports, currency movements generally head towards lower yielding and perceived safer currencies; USD and JPY in particular.

A good grasp of economics is generally recommended for traders wishing to start news releasing trading.

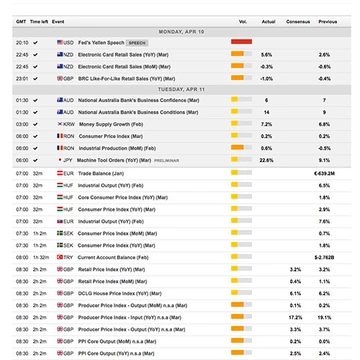
An economic news calendar is highly recommended. Forex Economic calendars show the release date for important economic news such as non-farm payroll, GDP figures and interest rate news. Below is an example of what an economic calendar shows:

ategy is the break out of a sideways trend. Usually, momentum is greatest on breakout points. A lot of traders take advantage of the breakout strategy when sideways moving prices break the upper or lower limits. Below represents a few breakouts following some periods of sideways tending.