blog6

How To Use The RSI Indicator In Forex Trading

Author:Exness Broker

The relative strength index (RSI) indicator is a technical indicator that is widely used by traders to identify oversold and overbought conditions within charts. The RSI is an oscillator type of indicator that moves up and down a scale from 0 to 100 depending on market conditions. The RSI is regarded as a leading indicator, which means that it can be used to predict future price movements in a financial instrument such as a currency pair. The RSI indicator was developed by J. Welles Wilder and introduced into the markets in 1978.

Understanding The RSI’s Signals The RSI indicator is usually presented as a horizontal chart attached to the bottom of a currency pair’ chart that features a single line that oscillates between 0 and 100.When the RSI is ranging from 0-30, this generally indicates oversold market conditions with a high probability of an upward correction in price. Whenever the RSI is ranging from 30-70, this is generally regarded as neutral territory (neither overbought or oversold). An RSI reading of 70-100 generally indicates an overbought market with a high likelihood of a price correction to the downside. When the RSI crosses from below the centerline (50 level) to the area above, this usually indicates a rising price trend in the affected currency pair. When the RSI cross from above the centerline to the area below it, this usually indicates a falling price trend in the affected currency pair.

RSI Divergence Signals The Relative Strength Index indicator might also show divergence in certain situations where the RSI line trends in the opposite direction to the prevailing price action in a currency pair. This is referred to as divergence, which can either be bullish or bearish, and indicates that a price reversal might be developing.

Bullish RSI Divergence Bullish RSI divergence typically occurs whenever the price of a currency pair is declining and the RSI line is rising, which is a strong bullish signal.

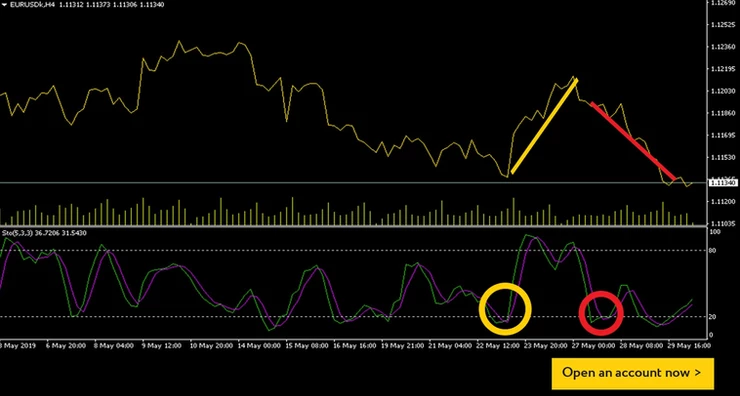
Bearish RSI Divergence Bearish RSI divergence typically occurs when a currency pair’s price is trending higher and the RSI line is falling, which is a strong bearish signal.

Analyzing RSI Signals Although the RSI overbought signal occurs when the RSI line crosses over the 70 mark, the time to actually sell the currency pair is when the RSI moves out of the overbought region. This is because the price can sometimes stay in the overbought range for extended periods and this can cause major losses for a trader that jumps in too early.To put it another way, the initial cross above the 70 mark typically serves as a warning to traders that they should prepare to sell once the RSI crosses back below the 70 mark. The same case applies to the RSI oversold signal, which typically occurs once the RSI line crosses below the 30 mark. You shouldn’t actually buy until the RSI line moves out of the oversold area.Whenever you are trading with the RSI divergence indicator, always place a trade in the direction confirmed by the RSI line after the price of the currency pair has closed two to three candles in your preferred direction.

How To Place Stop Loss And Take Profit Levels When using the RSI indicator, you should ideally place your stop loss order slightly beyond the latest swing top or bottom that occurred before the price reversal that you are trading. Your ideal take profit level should be when the RSI line crosses above or below the centerline (50 level), at which point you should lock in some of your profits, if any, using a trailing stop. In some cases, the trend might reverse at or near the centerline, which is why this is a good take profit level.

A Word Of Caution Just because the RSI indicates that an overbought or oversold condition exists, you shouldn’t always expect a price reversal. A currency pair in a strong trend might stay in overbought or oversold conditions for a long time. Also, because the RSI is a leading indicator, it can generate a lot of false signals when the asset it is being used to measure displays strong trend characteristics. You should always use stop loss orders to minimize you risk exposure when trading using the RSI.

How To Calculate The RSI Although most modern trading platforms, such as the MetaTrader 4 and MetaTrader 5, can and will calculate the RSI for you automatically, understanding how these calculations are made is useful for gaining better insight into how the RSI works.

The default setting for the RSI is 14 periods.

RSI = 100 – [100 / (1 + RS)] — Where: RS (Relative Strength) = average gain / average loss

Here is how you find relative strength: calculate the gains of the last 14 reporting period and divide by zero. This is your average gain. Now find the average loss by adding up all the losses from the last 14 reporting periods and divide them by zero.

Once you have calculated the two, you divide the average gain by the average loss to find the Relative Strength (RS) and apply it to the RSI formula.

Conclusion The relative strength index indicator is a useful tool that helps traders predict reversals of existing trends. The indicator generates trading signals when overbought or oversold conditions exist as well as when bullish or bearish divergence is identified within an existing trend. Also, given that the RSI is a leading indicator, it is quite prone to generating false trading signals and should always be used together with other indicators for trade confirmations.

Found this article useful? Create a Demo account to try RSI today.

blog12

Trading Strategy: Forget Price, Try Trading Volume

Are you ignoring the volume bars at the bottom of your price chart? It’s not unusual. Loads of traders prefer to track prices or

f

s when choosing a currency pair. At first glance, volume doesn’t seem to be the most powerful indicator, but there’s more to trading volume than meets the eye.


The volume section of your trading platform shows the total lots of the selected currency pair being bought or sold. For example, whenever heavyweight investors start opening huge trading contracts, trading volume quickly rises. Moreover, if the world’s media channels suddenly popularize a particular currency pair, trading volume tends to rise shortly after as thousands of traders open orders. In other words, trading volume is—among other things—a popularity meter. But how is that useful to you?

Volume and leverage

Before we even think about placing an order, we should first consider how volume relates to leverage. “Why leverage?” you may ask. What could volume and leverage have in common? Leverage is an important choice when you first go through the signup process. With Exness, you can open and manage multiple trading accounts from one convenient Personal Area. Each account can have a different leverage setting, which is very useful if you wish to trade both high volatility and low volatility pairs. The rule of leverage is simple and will give your trading strategy a solid foundation. low trading volume = low liquidity = high volatility = lower leverage

high trading volume = high liquidity = low volatility = higher leverage

A highly volatile currency pair could create huge profits when combined with high leverage, but such fragile orders tend to ‘Stop Out’ underfunded trading accounts in minutes when massive price fluctuations occur. Not recommended! Instead, try comparing the trading volumes of your favorite pairs with the major and minor currencies. If your pair is experiencing lower volume, then you might want to use a trading account with a lower leverage setting. Checking the volume of your preferred currency pairs could save you a lot of disappointment.

Strong price vs high price

Volume can be used to measure the ‘strength’ of a price shift, which answers a common question every trader asks themselves on a daily basis. “Is this price shift a coming reversal or just another bump in the road?”

Let’s consider a currency in a long-term downtrend. One day, the price begins to rise. Is this a breakout in the making, or just another fluctuation? A change in trend depends on many factors, but the first place to start checking is the trading volume. If the trading volume is low at the time of a price increase, then the market move is probably just a hiccup and the downtrend will return with a vengeance.

On the other hand, if the volume has been higher than usual, then you might be seeing the early stages of a price reversal. In a nutshell, low volume direction changes don’t stick. There are always exceptions to every trading strategy, but spotting a weak reversal is a very strong indicator.

How to test the trading strategy

Try opening up your trading platform and targeting a currency pair on the Market Watch list. Look back over the last few weeks until you find a significant fall in the trading volume, then check what happened to the price shortly after. Match your leverage to the average volume, then wait for the next possible breakout. If the price is reversing and the volume is rising, then the pair could be an attractive trading opportunity that deserves investigation or investment.


Open Exness Demo Account

Open FXTm Demo Account


blog7

How To Reduce Forex Risk Through Hedging

Author:Exness Broker

Hedging is a common strategy used by forex traders to limit the risks associated with some of their trades. Forex hedging strategies rely on positions opened by a trader in order to reduce their overall exposure to changes in prices of a given currency pair.

Although hedging strategies are usually employed to limit a trader’s risk, it is important to incorporate technical and fundamental analysis within any hedging strategy in order to make it effective. The best forex hedging strategies limit risk, but also take a cut of your profits. You can think of this as taking an insurance premium on your positions.

Hedgers Vs. Speculators A hedger’s primary motivation is to reduce the risks associated with price movements in the instruments they trade. On the other hand, a speculator takes positions in a given market with the primary motivation of making a profit from future price movements.

Hedging is largely a way of buying insurance against price movements that do not favor your current and future positions. As we’ll see, forex traders also use hedging as a way to generate potential profits.

Achieving Market-Neutral Positions Achieving market-neutral positions through hedging usually involves identifying two currency pairs that are positively correlated, and initiating opposite trades in each of the currency pairs. Examples of positively correlated currency pairs include the EURUSD and GBPUSD, as well as the AUDUSD and the NZDUSD.

The most important aspect of hedging is to choose two correlated pairs that move somewhat asymmetrically to each other. For example, when trading the AUDUSD and NZDUSD currency pairs, you take opposite positions across the two pairs as a hedging strategy. In this instance, as the NZD is a less volatile currency, you have to compensate with a larger trade size as compared to the opposite AUD trade.

A Word Of Caution There are some retail traders who use hedging strategies to minimize existing loses on a losing trade. For example, if a trader has entered into a losing EURUSD long trade, they might decide to open a short EURJPY trade in order to mitigate their losses by booking some gains from the short trade.However, opening a hedging trade to minimize the losses from a losing trade is very risky given that such a trader could ends up compounding the risks associated with their trades. In the above example, by opening a EURJPY short trade, the trader is now exposed to fluctuations in JPY, USD and EUR.

Hedging Strategies On The Same Currency Pair Hedging on the same currency pair is an advanced strategy based on executing different types of trades on the same pair using different lot sizes to minimize losses and maximize profits. This strategy is best suited for intermediate and advanced forex traders.Here’s an example of such a strategy. A trader buys 0.1 lots of the EURUSD currency pair at 1.2130, after which they quickly opens a sell stop order of 0.3 lots on the same pair at 1.2100. This would protect them regardless of the direction in which the currency pair moves.

In this instance, if the currency pair does not rally to the initial profit target of 1.2160 for a 30 pip gain, but instead declines to a low of 1.2070, they would still profit. This is because the sell stop order becomes an active sell order once the pair breaches the 1.2100 level.

Conclusion This article provides a brief overview of the different hedging strategies that you can use when trading the forex markets. Hedging is an essential skill to learn in order to limit the risks associated with your open positions. Through a Demo acDemo account, you can test these strategies before applying them to live trades.

blog25

Indicators 101: How to Use Fibonacci Retracement

In this article, I’m going to show you how to apply Fibonacci retracement levels to a chart and what information it provides. Remember, indicators “indicate” possible price moves and entry-exit points. You’ll still need to interpret the data for yourself, so I’ll show you how to do that too.


What is Fibonacci retracement

Let’s break down the words Fibonacci and retracement to better understand what this tool does.

Fibonacci was an Italian mathematician who discovered a sequence of numbers that occurs in nature. This infinite sequence is created by adding together the preceding two numbers on the list to create the next number. For example: 0, 1, 1, 2, 3, 5, 8, 13, 21, etc.

Retracement refers to how a price trend can sometimes temporarily fall back before continuing in the direction of the trend.

Why is Fibonacci retracing so useful?

The Fibonacci Retracement tool helps traders identify levels for setting Buy Stop Limits or Sell Stop Limits that can activate orders whenever a price retracement occurs. The indicator lines also help when searching for a trading entry point level on a trending price move.

How to set up Fibonacci levels

Open your Exness demo account and let’s apply the Fibonacci tool to a chart. EURGBP often displays volatility. It’s a perfect pair to demonstrate how the Fibonacci tool can help you set a more profitable order prior to a price retracement. On the top menu of your trading platform, set the timeframe to H4 (4 hourly) and display the price as a line.

Go to the top menu >> Insert >> Fibonacci >> Retracement

On the chart, draw a line at the start of a trend to the point of reversal by holding down the left mouse button until you get to the break.

If a retracement occurs, how low will it go? That’s where the yellow lines or levels can help with your forecasting. The displayed Fibonacci levels or lines offer several entry points. Assuming the trend continues, the higher the line value the greater the profit. These entry points levels can be customized, but most traders don’t mess with the defaults. So which level should you choose for your entry point?

Fibonacci retracement entry points

In the example above, EURNZD started a bull run at 4:00 pm on March 26. A retracement began four hours later. The Fibonacci tool displays six levels ranging from 0.0 (no retracement) to 100.0 (full reversal). Choosing the right level is ultimately your decision, but the Fibonacci levels work as an effective guideline or benchmark. Just remember that an indicator is not a time machine and market prices don’t always follow the mathematical rules.

23.6: A small move that happens all the time and offers limited value or improved profitability.

38.2: An accurate forecast at this level creates attractive profits, and the likelihood of it occurring remains quite high.

50.0: Half retracement. Not a tall order by any means, but the improvement to your profit ratio improves significantly—compared to opening a position on the high.

61.8: Entering the realm of more and more unlikely. To catch such a reversal in the middle of a rally is a long shot, but highly profitable when it happens.

Most conservative traders will probably set entry levels between 23.6 and 50.0 but that number will rise as your knowledge and experience grows.

In the example above, the reversal dropped to the 38.2 mark and then continued to rally well beyond the price at the time of drawing the Fibonacci lines.

Top Fibonacci trading tip

Remember, market prices won’t always fit in with Fibonacci levels so perfectly. Many unexpected changes can and will affect your orders if you trade on a daily basis. Most traders agree that the longer the timeframe and greater the price difference, the more accurate the forecast.

Trading indicator tools can be likened to comments on Amazon. You’ll get better results in the long-term if you take more than one into consideration, so work hard and use other indicators together with fundamental analysis.

Test the Fibonacci trading tool on a real or demo account


Open Exness Demo Account

Open Alpari Demo Account


The Breakout Strategy

The Breakout Str

News Release Trading Strategy

News traders trade off economic news release. The Forex market is particularly reactive to economic news, in particular, interest rate news from the G8 countries, as well as unemployment news for each corresponding country. News traders will have to bear in mind that the Forex market movements have already taken in to consideration existing and expected economic news. The sharp movements you see due to economic news are corrections due to unexpected news, either better than expected or worse than expected.

Another consideration to take to heart for potential news traders is that during negative sentiment news reports, currency movements generally head towards lower yielding and perceived safer currencies; USD and JPY in particular.

A good grasp of economics is generally recommended for traders wishing to start news releasing trading.

An economic news calendar is highly recommended. Forex Economic calendars show the release date for important economic news such as non-farm payroll, GDP figures and interest rate news. Below is an example of what an economic calendar shows:

ategy is the break out of a sideways trend. Usually, momentum is greatest on breakout points. A lot of traders take advantage of the breakout strategy when sideways moving prices break the upper or lower limits. Below represents a few breakouts following some periods of sideways tending.

blog30

Stochastic: What’s it Really Showing You?

Ever heard the expression “getting ahead of the curve?” In trading, this cliche perfectly reflects what every trader wishes they could consistently do. In addition to fundamental analysis, you might turn to charts to forecast price moves. A big part of using charts to make sense of the markets are indicators, but are they really any good? Many traders turn to the Stochastic indicator to check overbought or oversold levels, so just what insights does Stochastic analysis really offer, and how can you use these insights to determine when to open a position?


Here’s an overview of this popular indicator, why you might be struggling to use it, and some top tips that will help you avoid misinterpreting market moves.

Get free access to our trading platform and hundreds of indicators

Overbought and oversold

The terms overbought and oversold describe a period where there has been significant movement in price without much pullback or reversion. Simply put, a rise or fall that doesn’t deviate far from the trend line.

What goes up…! You know the saying. Price trends can’t last forever. They eventually reverse, and trading close to that point of reversal is one way you can maximize your profits. In traditional technical analysis, traders expect overbought or oversold currency pairs to reverse, but that’s not always the case and it can be quite an expensive realization. To constantly set your trades based on the Stochastic indicator will yield mixed and likely disappointing results.

How to read the Stochastic

If you’ve already signed up with Exness, then you have access to a trading platform and a risk-free demo account. This is the perfect way to get familiar with any of the free and paid indicators available. Open up your platform and go to the Navigator pane on the left. Scroll down and then drag the Stochastic folder to the chart. A section will appear below the price chart with two lines tracing along, above, and below a central range.

The concept is fairly simple. The lower horizontal line represents a value of 20. The upper horizontal line is 80. Whenever the tracing line breaches 80, it indicates a possible overbought status, and traders expect a price correction. Likewise, if the lines cross below the 20-mark, it signals a possible oversold status, and a reversal might be imminent.

In the above EURUSD example, a downtrend started on May 19 and crossed the 20-line on May 22 [yellow]. Traders using the Stochastic indicator would normally take this as a sign of overbought, and they would set a buy order with the expectations of a reversal. They would consequently be very pleased with the rise that followed. Just five days later, Stochastic indicated another oversold status [blue], but traders clicking the buy buttonprobably lost whatever profits they’d achieved the previous week. So, what’s going on?

Indicators are not fortune-tellers

FX News does not recommend using the Stochastic indicator as a stand-alone forecasting strategy. Indicators are best used to confirm theories, not to create them. Having said that, Stochastic is one of the best indicators a trader can use, but you might consider adding a little common sense to the mix. In the yellow example above, you can see that the price line and the Stochastic lines match rather well in the days preceding the oversold signal—and continue to do so after the fact. The perfect example of how a Stochastic indicator can forecast a reversal!

The blue example a few days later shows a clear divergence. The Stochastic line falls dramatically in a complete reversal from overbought to oversold, but the price line barely moves in comparison. Consider that a warning sign! Another common indicator is that the reversal usually comes when the rise or fall happens in a short period of time. Watch out for steep peaks and valleys that accompany the overbought/oversold range.

Top trading tips for advanced traders

Although we’ve used a price line to better illustrate the price moves in the chart image, FX News suggests using candlesticks when performing chart analysis. Moreover, Stochastic’s default %K period and slowing is set at 5,3,3, but cautious traders usually use higher numbers. On the top menu, go to Insert > Indicators > Oscillators > Stochastic Oscillator and set to 15,5,5. You can run both settings at the same time to see the differences. Certain settings may work better for certain pairs, so play around with the levels before committing to one.


Test Stochastic on your Exness trading platform

Open Exness Demo Account

Open Tickmill Demo Account

Open FXTm Demo Account