blog20

Why Is Liquidity So Important?

Have you ever run into the word “liquidity” while reading a financial report? It’s a term that gets thrown around by forex analysts all the time. Understanding liquidity can help you choose the right order types, which leverageto use, and how long you should keep your orders open. Soon you’ll understand the relationship between liquidity and volatility. Take your trading skills to the next level with this introduction to liquidity.

So what is forex liquidity and why should you care?

Liquidity is a measure of how easily a forex currency pair can be traded. Investments that can quickly be converted into cash are said to have high liquidity. The forex CFD market is liquid by nature, and traders can open and close trades in just a few clicks.


In contrast, real estate investment is much less liquid—especially during times of economic uncertainty. People selling a property may have a long wait until they can convert their investment back into cash, which is probably why forex has become so popular as an investment vehicle. Since liquidity indicates a safer or less volatile investment option, you might want to build your trading skills by limiting your trades to high liquidity currency pairs.

How can you find high liquidity currency pairs?

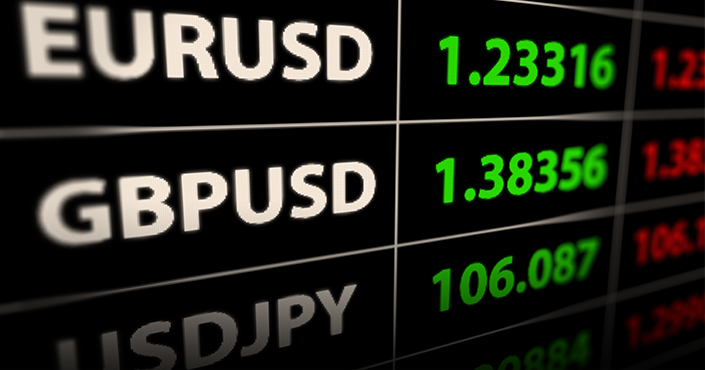
So you’re looking for a currency pair that offers the benefits of liquidity. Trading volume is a good indicator of liquidity. Trading volume refers to the amount and size of the orders being placed on a given currency pair. The more volume, the more stable the price line. The eight currency pairs with the highest volume and therefore liquidity are: EURUSD (Euro vs US dollar)

USDJPY (US dollar vs Japanese yen)

GBPUSD (British pound sterling vs US dollar)

AUDUSD (Australian dollar vs US dollar)

USDCAD (US dollar vs Canadian dollar)

USDCNH (US dollar vs Chinese renminbi)

USDCHF (US dollar vs Swiss franc)

EURGBP (Euro vs British pound sterling)

So now you know which pairs are favorably liquid, but why is this important? To better understand how liquidity influence prices, let’s scale everything down. Imagine that the liquidity for EURUSD comes from just 100 traders. One day, five people don’t make any orders. Trading volume shows a drop of around 5%. Prices will adjust, but nothing major will happen on the market. Now let’s consider an exotic currency pair like USDSEK. This time, only 10 traders generate the liquidity. One day, five traders don’t make an order. Trading volume drops by around 50%. Prices will adjust rapidly, and dangerous volatility will follow.

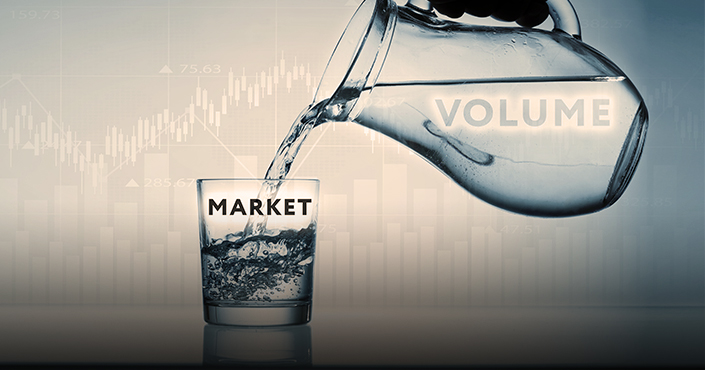
It all starts with volume

Let’s look at a real world example to demonstrate how volume changes the behaviour of the currency and price moves. Imagine three vehicles. A car, a bus, and a ship. The car represents those currency pairs that don’t get a lot of trading volume. Cars can be fast, light, and more maneuverable. The car can rapidly swerve or change direction, and even turn around at a moment’s notice. Because of the  limited volume, you can expect a wild ride when trading the “smaller” currency pairs. The bus is a heavier vehicle and much less maneuverable, and it carries a much higher volume.  It’s not the most popular choice for traders, but the higher volume still offers a slower, less-volatile ride.

The ship is by far the slowest at making course changes. Ships have massive volume compared to other vehicles. These “bigger” currency pairs are traded by many, enjoy endless liquidity, and make for a much smoother ride.The eight listed currency pairs above could be considered “ships”. Major currency pairs have massive volumes, and a change in direction is usually slow. The charts appear smoother with fewer spikes. Simply put, the more liquidity, the more volume, the slower the price change. The exception to this is when something “big” happens. When a nation makes a political or economiceconomic announcement that traders perceive as “bad for business”, investors can make the same conclusion at the same time and abandon the vehicle, destabilizing it as they go..

Example: When the UK announced Brexit in 2016, GBP investors everywhere probably came to the conclusion that a non-EU destination would be economic suicide. GBP investors started jumping ship, and sterling started sinking. Some traders stayed loyal and hopeful, and they are now battling a stormy or volatile transition.

Top tip for high liquidity traders

Trading high liquidity pairs means you can use wider ‘Take Profit’ and ‘Stop Loss’ settings. You might also consider a higher leverage depending on how stable the currency pair is. When checking for price reversals, sharp moves can be misleading. Make sure there’s plenty of volume behind the change. Whichever currency pairs you choose to trade, always take liquidity into consideration before setting leverage and stop orders.

Open Exness Demo Account

Open FXTm Demo Account


blog30

Stochastic: What’s it Really Showing You?

Ever heard the expression “getting ahead of the curve?” In trading, this cliche perfectly reflects what every trader wishes they could consistently do. In addition to fundamental analysis, you might turn to charts to forecast price moves. A big part of using charts to make sense of the markets are indicators, but are they really any good? Many traders turn to the Stochastic indicator to check overbought or oversold levels, so just what insights does Stochastic analysis really offer, and how can you use these insights to determine when to open a position?


Here’s an overview of this popular indicator, why you might be struggling to use it, and some top tips that will help you avoid misinterpreting market moves.

Get free access to our trading platform and hundreds of indicators

Overbought and oversold

The terms overbought and oversold describe a period where there has been significant movement in price without much pullback or reversion. Simply put, a rise or fall that doesn’t deviate far from the trend line.

What goes up…! You know the saying. Price trends can’t last forever. They eventually reverse, and trading close to that point of reversal is one way you can maximize your profits. In traditional technical analysis, traders expect overbought or oversold currency pairs to reverse, but that’s not always the case and it can be quite an expensive realization. To constantly set your trades based on the Stochastic indicator will yield mixed and likely disappointing results.

How to read the Stochastic

If you’ve already signed up with Exness, then you have access to a trading platform and a risk-free demo account. This is the perfect way to get familiar with any of the free and paid indicators available. Open up your platform and go to the Navigator pane on the left. Scroll down and then drag the Stochastic folder to the chart. A section will appear below the price chart with two lines tracing along, above, and below a central range.

The concept is fairly simple. The lower horizontal line represents a value of 20. The upper horizontal line is 80. Whenever the tracing line breaches 80, it indicates a possible overbought status, and traders expect a price correction. Likewise, if the lines cross below the 20-mark, it signals a possible oversold status, and a reversal might be imminent.

In the above EURUSD example, a downtrend started on May 19 and crossed the 20-line on May 22 [yellow]. Traders using the Stochastic indicator would normally take this as a sign of overbought, and they would set a buy order with the expectations of a reversal. They would consequently be very pleased with the rise that followed. Just five days later, Stochastic indicated another oversold status [blue], but traders clicking the buy buttonprobably lost whatever profits they’d achieved the previous week. So, what’s going on?

Indicators are not fortune-tellers

FX News does not recommend using the Stochastic indicator as a stand-alone forecasting strategy. Indicators are best used to confirm theories, not to create them. Having said that, Stochastic is one of the best indicators a trader can use, but you might consider adding a little common sense to the mix. In the yellow example above, you can see that the price line and the Stochastic lines match rather well in the days preceding the oversold signal—and continue to do so after the fact. The perfect example of how a Stochastic indicator can forecast a reversal!

The blue example a few days later shows a clear divergence. The Stochastic line falls dramatically in a complete reversal from overbought to oversold, but the price line barely moves in comparison. Consider that a warning sign! Another common indicator is that the reversal usually comes when the rise or fall happens in a short period of time. Watch out for steep peaks and valleys that accompany the overbought/oversold range.

Top trading tips for advanced traders

Although we’ve used a price line to better illustrate the price moves in the chart image, FX News suggests using candlesticks when performing chart analysis. Moreover, Stochastic’s default %K period and slowing is set at 5,3,3, but cautious traders usually use higher numbers. On the top menu, go to Insert > Indicators > Oscillators > Stochastic Oscillator and set to 15,5,5. You can run both settings at the same time to see the differences. Certain settings may work better for certain pairs, so play around with the levels before committing to one.


Test Stochastic on your Exness trading platform

Open Exness Demo Account

Open Tickmill Demo Account

Open FXTm Demo Account