blog18

Want To Trade Forex Like An Expert? Plan Your Profits

Why Letting Profits Run Can Sometimes Pay Off

Just as many forex traders are too slow to cut their losses, many are also too quick to close their trades to claim their profits when a trade does go their way. Closing a trade too early prevents you from taking full advantage when, for example, a major market shift occurs in your favor. How do you avoid missing out? First, you can use an analytical tool like average true range (ATR) to predict periods of volatility in the market before they occur. How to recognize this? One sign can be periods of unusually low volatility. These often precede big swings up or down in the price of an item. When this is the case, you can use trailing stops, an automatic stop-out order you set with your broker where the limit follows the price upwards, or you can cash out only partially as your profits mount.


Top Tip: Learning when to let profits run takes planning, time, and experience — but is well worth doing


Open Exness Demo Account

Open FXTm Demo Account


Tags:

AUD, Brexit, Brexit, Banks, CAD, CHF, CNH. currency hedging, CZK, Donald Trump, EU EUR, forex trading, GBP, Global, Growth, Fears, Gold Prices, Government Shutdown, HKD, Is forex trading profitable, JPY Leverage, Mean Reversion, MXN, NOK, NZD, Passive income, popular strategies, Risk Management, RUB, Safe, haven currencies, second referendum, SEK SGD, Silver, Price, technical indicators, trading account, Trading Basics, trading psychology, Trailing Stop, trump wall, TRY USD, USD Price, Chart, XAG, XAU, ZAR,

blog19

Bars, Lines, or Candlesticks? Reading Forex Charts Like a Pro

Are you struggling to find trading opportunities when you use fundamental analysis? News reports and eco releases can be strong influencers of market price, but sometimes they don’t give a clear enough indication of what to trade, and more investigation is called for. Time to check the forex charts!

Some traders use indicators to make sense of price history, while others prefer to “eyeball” the situation and make their own conclusions. Either way, it comes down to technical analysis and recognizing patterns in the price history, which brings us to the topic of this article. Which forex chart type reveals more? Should you use lines, bars, or candles? Here’s a simple breakdown of those options so you can start using the one that best suits your trading style.

Line charts

Right-click on an open forex chart and you’ll see three viewing options: lines, bars, and candlesticks. Lines display a currency pair’s price history in a much cleaner way. Lines track a simple straight line between the opening price and the closing price. Anything that happens between those two points will not be visible on a line chart. Since line charts don’t show the daily highs and lows, it makes them better suited to long-term analysis offering a wider simplistic overview. If you are planning to keep an order open for more than a week, then lines give a much cleaner picture from which to base forecasts. For short-term orders that present a risk of volatility, a bar chart is much more informative.


Bar charts

Like lines, bars also show the opening and closing prices, but bars display price highs and lows. The lowest and highest levels on each bar represent the lows and highs for the selected period. To the left of the bar is the opening price, to the right is the closing price

Most traders find bars harder to read than price lines, but there are certain advantages to using bars when performing technical analysis. When setting ‘Stop Loss’ (SL) and ‘Take Profit’ (TP), it can be useful to indicate just how extreme the lows and highs are compared to the closing prices. If the bars are long, but the opening and closing prices are crammed closer to the middle, it can mean that the selected period is experiencing price volatility. Extreme highs and lows tend to prematurely trigger a tight ‘SL’ or ‘TP’ order. If you’re opening a trade for the day, check the previous candlesticks to see if the wicks were far from the open and close? Set your ‘SL’ or ‘TP’ accordingly.


Candlestick charts

Candlesticks are probably the most popular way to view forex charts. This type of chart shows the same trading information as bars, but many traders prefer the style and insist that they are easier to read.

CSimilar to bars, the candlestick body shows the opening and closing prices, and the wicks that are sticking out of the top and/ or bottom represent the highs and lows of the selected period. The direction of the price for the period is shown by the color used. The most popular contrasts being green for a rise and red for a fall, but this is a completely customizable feature.

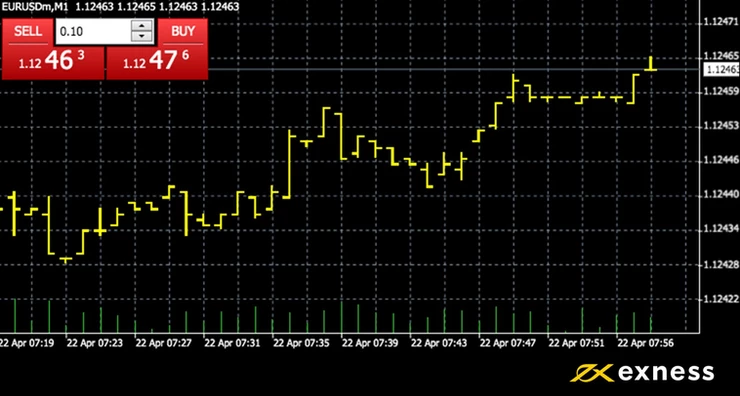
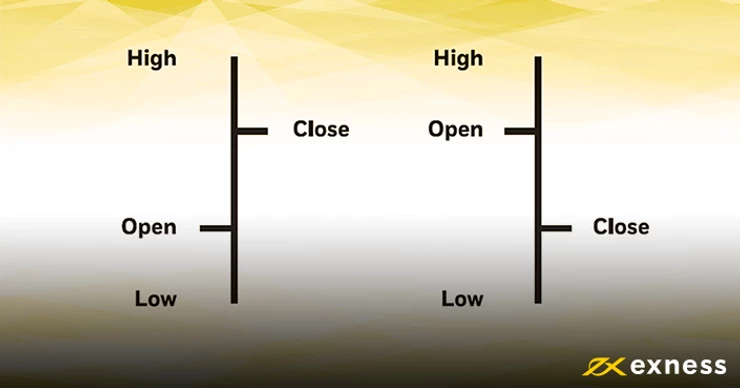
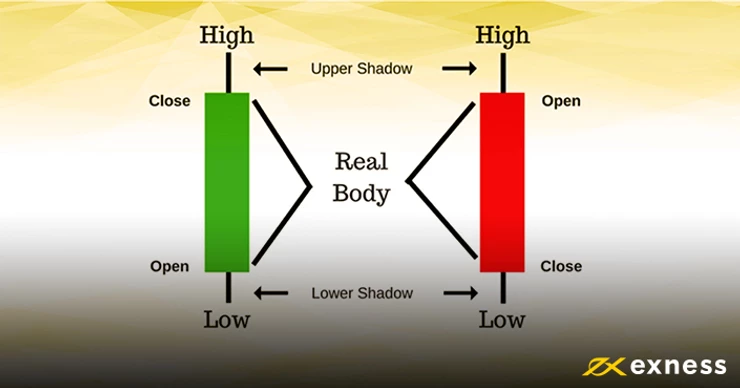
Just remember that the highs and lows never change, but the opening price on a candlestick switches place whenever the price direction changes. A rising trend opens on the bottom. A declining trend opens on the top. Candlesticks take a little getting used to, but when you do, there are dozens of patterns to watch out for that have a history of indicating rally moves or crashes.


So which forex chart is better for forecasting?


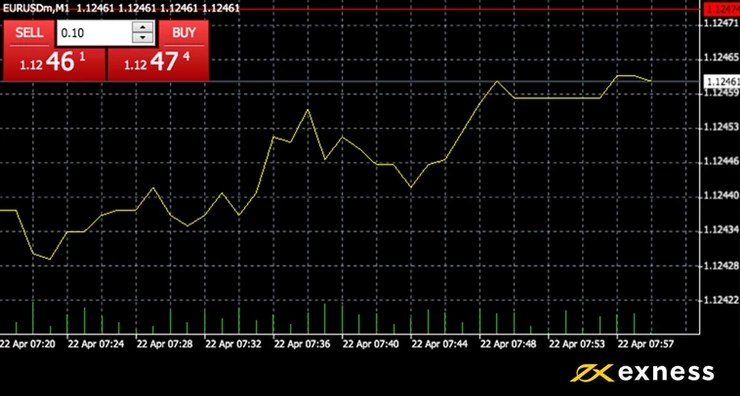
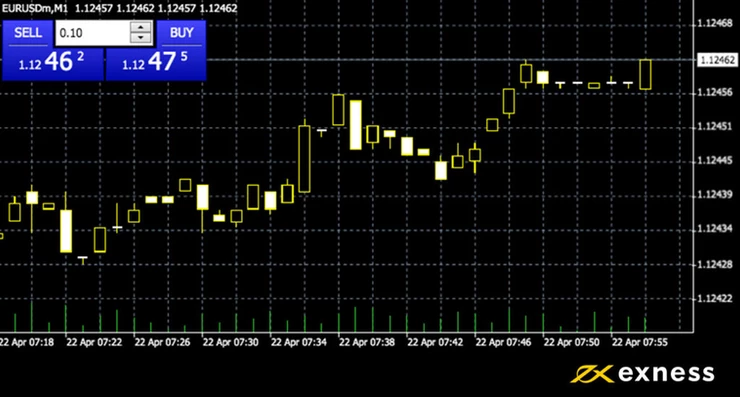
Take a look at the three forex chart screenshots in this article. Which one seems the easiest to read or analyze? It’s really down to your own personal preference. Lines are great for a quick and easy overview, but they show much less when you’re looking at a one-minute timeframe. Consider using lines for long-term trading analysis or quick checks on how a fundamental release is affecting market prices. If you tend to open and close orders in the same day, candlesticks might be a better choice.


Test your analytical eye on the foreign exchange market


Open Exness Demo Account

Open FXTm Demo Account


Tags:


AUD, Brexit, Brexit, Banks, CAD, CHF, CNH. currency hedging, CZK, Donald Trump, EU EUR, forex trading, GBP, Global, Growth, Fears, Gold Prices, Government Shutdown, HKD, Is forex trading profitable, JPY Leverage, Mean Reversion, MXN, NOK, NZD, Passive income, popular strategies, Risk Management, RUB, Safe, haven currencies, second referendum, SEK SGD, Silver, Price, technical indicators, trading account, Trading Basics, trading psychology, Trailing Stop, trump wall, TRY USD, USD Price, Chart, XAG, XAU, ZAR, indicator, Forex Millennium, Karl , golden rebate, rebate, cashback,


blog28

Do Forex Signals Really Work?

So, you’ve funded your trading account, and you’re ready to make some trades. Now it’s time to analyze the market and find some attractive trading options. Researching currency pairs can take a big chunk out of your free time, and it’s not uncommon to end your market investigation as lost as when you started. If that’s you, don’t despair. You’re not alone, which is why professional market analysts and A.I. programmers got together to create forex signals. But are those signals any good?

Why do traders use forex signals?

Technical indicators, news reports, fundamental analysis, who has time to analyze the dozens of trading instruments available on your trading platform? If your life is like mine, it’s hard to find time to properly research the market. But what if somebody or something could do all the research for us and then send a report with statistics and clear conclusions?

It’s so convenient. Forecasts that normally take hours to perform just appear in your inbox or MetaTrader message board in the form of a signals report, all thanks to a team of professional forex analysts working in concert with A.I. technology.

Traders of all levels and experience use signal provider services and their associated apps. While some forex signals services are free, others have a fee; there are hundreds, so choosing which one to go with takes time and investigation. Moreover, some work better than others.


Which forex signals providers can you trust?

This question is difficult to answer. Forex signals get constant updates and performance changes with each update. Signal performance and accuracy also varies from brand to brand. From as low as 60% up to an unconfirmed 92% win/loss ratio. One forex signal provider’s performance might be strong during the time of writing this article, but things can change in a matter of days. Keeping current with the top signal providers can take up as much time as keeping current with the forex market. Fortunately, there is a solution.

The easy way to choose a signal provider

To make sure you’re getting the latest forex signals, just stick to the more established and popular services. There’s a reason they are so popular! One signal provider worth considering in 2019 is the award-winning Trading Central. For almost 20 years, Trading Central has been supporting investment decisions for forex traders, and it is a consistent leader in the industry. Professional analysts monitor Trading Central’s tried and tested algorithms, and their performance and reputation is solid, which is why Exness gives free access to Trading Central signals directly on your trading platform.

Top tip: Some signal providers have had better performance percentages than Trading Central, but their consistency is lacking and not really worth mentioning. Try comparing multiple signal providers. Keep a diary of the signal forecasts then go back and check to see which ones gave better signals. If the majority of signal providers are saying the same, then you might be onto a sure thing.

As always, FX News recommends that you understand every order you make, and not blindly follow forex signals or forecasts. Find time to conduct your own market research and learn and grow as you go.

Try signals trading and see if it’s right for you!


Open Exness Demo Account

Open Tickmill Demo Account

Open FXTm Demo Account