blog25

Indicators 101: How to Use Fibonacci Retracement

In this article, I’m going to show you how to apply Fibonacci retracement levels to a chart and what information it provides. Remember, indicators “indicate” possible price moves and entry-exit points. You’ll still need to interpret the data for yourself, so I’ll show you how to do that too.


What is Fibonacci retracement

Let’s break down the words Fibonacci and retracement to better understand what this tool does.

Fibonacci was an Italian mathematician who discovered a sequence of numbers that occurs in nature. This infinite sequence is created by adding together the preceding two numbers on the list to create the next number. For example: 0, 1, 1, 2, 3, 5, 8, 13, 21, etc.

Retracement refers to how a price trend can sometimes temporarily fall back before continuing in the direction of the trend.

Why is Fibonacci retracing so useful?

The Fibonacci Retracement tool helps traders identify levels for setting Buy Stop Limits or Sell Stop Limits that can activate orders whenever a price retracement occurs. The indicator lines also help when searching for a trading entry point level on a trending price move.

How to set up Fibonacci levels

Open your Exness demo account and let’s apply the Fibonacci tool to a chart. EURGBP often displays volatility. It’s a perfect pair to demonstrate how the Fibonacci tool can help you set a more profitable order prior to a price retracement. On the top menu of your trading platform, set the timeframe to H4 (4 hourly) and display the price as a line.

Go to the top menu >> Insert >> Fibonacci >> Retracement

On the chart, draw a line at the start of a trend to the point of reversal by holding down the left mouse button until you get to the break.

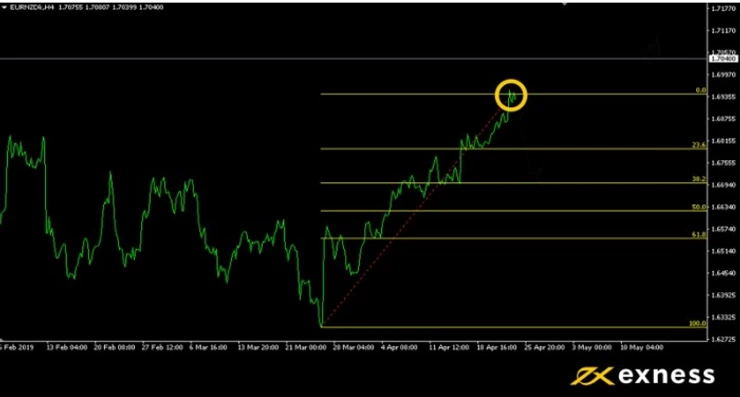
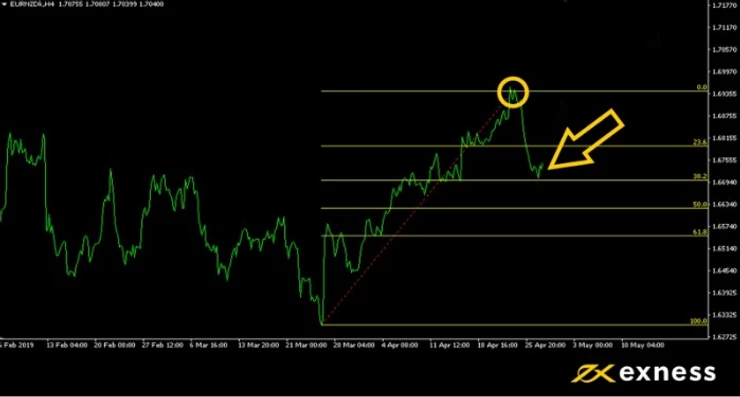
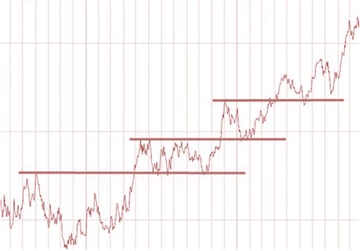
If a retracement occurs, how low will it go? That’s where the yellow lines or levels can help with your forecasting. The displayed Fibonacci levels or lines offer several entry points. Assuming the trend continues, the higher the line value the greater the profit. These entry points levels can be customized, but most traders don’t mess with the defaults. So which level should you choose for your entry point?

Fibonacci retracement entry points

In the example above, EURNZD started a bull run at 4:00 pm on March 26. A retracement began four hours later. The Fibonacci tool displays six levels ranging from 0.0 (no retracement) to 100.0 (full reversal). Choosing the right level is ultimately your decision, but the Fibonacci levels work as an effective guideline or benchmark. Just remember that an indicator is not a time machine and market prices don’t always follow the mathematical rules.

23.6: A small move that happens all the time and offers limited value or improved profitability.

38.2: An accurate forecast at this level creates attractive profits, and the likelihood of it occurring remains quite high.

50.0: Half retracement. Not a tall order by any means, but the improvement to your profit ratio improves significantly—compared to opening a position on the high.

61.8: Entering the realm of more and more unlikely. To catch such a reversal in the middle of a rally is a long shot, but highly profitable when it happens.

Most conservative traders will probably set entry levels between 23.6 and 50.0 but that number will rise as your knowledge and experience grows.

In the example above, the reversal dropped to the 38.2 mark and then continued to rally well beyond the price at the time of drawing the Fibonacci lines.

Top Fibonacci trading tip

Remember, market prices won’t always fit in with Fibonacci levels so perfectly. Many unexpected changes can and will affect your orders if you trade on a daily basis. Most traders agree that the longer the timeframe and greater the price difference, the more accurate the forecast.

Trading indicator tools can be likened to comments on Amazon. You’ll get better results in the long-term if you take more than one into consideration, so work hard and use other indicators together with fundamental analysis.

Test the Fibonacci trading tool on a real or demo account


Open Exness Demo Account

Open Alpari Demo Account


The Breakout Strategy

The Breakout Str

News Release Trading Strategy

News traders trade off economic news release. The Forex market is particularly reactive to economic news, in particular, interest rate news from the G8 countries, as well as unemployment news for each corresponding country. News traders will have to bear in mind that the Forex market movements have already taken in to consideration existing and expected economic news. The sharp movements you see due to economic news are corrections due to unexpected news, either better than expected or worse than expected.

Another consideration to take to heart for potential news traders is that during negative sentiment news reports, currency movements generally head towards lower yielding and perceived safer currencies; USD and JPY in particular.

A good grasp of economics is generally recommended for traders wishing to start news releasing trading.

An economic news calendar is highly recommended. Forex Economic calendars show the release date for important economic news such as non-farm payroll, GDP figures and interest rate news. Below is an example of what an economic calendar shows:

ategy is the break out of a sideways trend. Usually, momentum is greatest on breakout points. A lot of traders take advantage of the breakout strategy when sideways moving prices break the upper or lower limits. Below represents a few breakouts following some periods of sideways tending.

blog26

A Trader’s Guide to Closing Orders

This article is dedicated to those of you who already have a trading account but haven’t managed to establish a trading routine yet. There’s so much to learn, and it can sometimes feel overwhelming. There are tutorials that show you how to use the trading platforms, and economic news releases that can help you find a currency pair to trade. What’s hard to find is an explanation of how high you should set your profit goals. Even more elusive is a clear rule for how long you should keep your orders open. Here’s a simple strategy for setting your exit points based on price history instead of profits or losses.

Stopping orders at the right time

If you’ve built your trading confidence on the Exness demo account, then you’ve probably seen some sizable profits and losses. Keep in mind that your trading goal is not to be consistently profitable—that’s not a realistic option. Keeping the total profits above the total losses is something full-time traders usually aim for, and there are many techniques that can help with that. Of course, that’s easier said than done, but there are some areas that more inexperienced traders often overlook. Let’s say, you’ve got an open order on your trading platform. You’re hopefully thinking of setting your Stop Loss and Take Profit levels, but what you might not be sure about is the exit points. This is where the chart timeframes can help. Firstly, just how long are you planning to keep your orders open? It’s the first thing to consider. If you place an EURUSD order for the day, your Take Profit and Stop Loss setting could be very different from an intended month-long order. Here’s why.

Timeframe analysis

Timeframe analysis is primarily used for trend trading. For example, if you are thinking of trading XAUUSD, you might consider sticking to longer timeframes for analysis and speculation. This is because gold has a slow and slightly more predictable rise over the course of each year. It is considered by many traders as a long-term investment option. When you set your exit points, set your timeframe to show the big picture. If you plan to close the order in a month, what were the prices one month ago? Apply this logic to all your trades, then compare the historic price level with the current level of resistance.  In contrast, if you are day trading, don’t expect the prices to go far beyond what you’ve seen over the last 24-hours. Whatever levels prices reached last year shouldn’t influence your short-term orders.

Top trading tip

Ideally, you are looking for trends that are consistent on multiple timeframes. If, for example, both short-term and long-term trends have bullish indicators, a Buy order could be a strong option. If the short-term trend shows bearish tendencies within a long-term uptrend, caution is advised.

Reading price charts is not something that can be learned in a day. Like driving a car, you need to spend time practicing before you take to the highway. Make time to check the timeframes of multiple currency pairs each day. Look at the time period you intend to trade and take detailed notes on price history. How much movement occurred over how much time? Make conclusions and write down why you think a Buy or Sell order is favorable, then go back to previous conclusions and see if you were right or wrong.

As you learn from your mistakes, your perceptions of the market’s ebb and flow will change. Remember, the goal of this strategy is to have more profits than losses. You’ll never win them all, but there’s always room for improvement.

Test and develop your analytical skills risk-free on a demo account

Open Exness Demo Account

Open Alpari Demo Account

Open Errante Demo Account