blog26

A Trader’s Guide to Closing Orders

This article is dedicated to those of you who already have a trading account but haven’t managed to establish a trading routine yet. There’s so much to learn, and it can sometimes feel overwhelming. There are tutorials that show you how to use the trading platforms, and economic news releases that can help you find a currency pair to trade. What’s hard to find is an explanation of how high you should set your profit goals. Even more elusive is a clear rule for how long you should keep your orders open. Here’s a simple strategy for setting your exit points based on price history instead of profits or losses.

Stopping orders at the right time
If you’ve built your trading confidence on the Exness demo account, then you’ve probably seen some sizable profits and losses. Keep in mind that your trading goal is not to be consistently profitable—that’s not a realistic option. Keeping the total profits above the total losses is something full-time traders usually aim for, and there are many techniques that can help with that. Of course, that’s easier said than done, but there are some areas that more inexperienced traders often overlook. Let’s say, you’ve got an open order on your trading platform. You’re hopefully thinking of setting your Stop Loss and Take Profit levels, but what you might not be sure about is the exit points. This is where the chart timeframes can help. Firstly, just how long are you planning to keep your orders open? It’s the first thing to consider. If you place an EURUSD order for the day, your Take Profit and Stop Loss setting could be very different from an intended month-long order. Here’s why.

Timeframe analysis

Timeframe analysis is primarily used for trend trading. For example, if you are thinking of trading XAUUSD, you might consider sticking to longer timeframes for analysis and speculation. This is because gold has a slow and slightly more predictable rise over the course of each year. It is considered by many traders as a long-term investment option. When you set your exit points, set your timeframe to show the big picture. If you plan to close the order in a month, what were the prices one month ago? Apply this logic to all your trades, then compare the historic price level with the current level of resistance.  In contrast, if you are day trading, don’t expect the prices to go far beyond what you’ve seen over the last 24-hours. Whatever levels prices reached last year shouldn’t influence your short-term orders.

Top trading tip

Ideally, you are looking for trends that are consistent on multiple timeframes. If, for example, both short-term and long-term trends have bullish indicators, a Buy order could be a strong option. If the short-term trend shows bearish tendencies within a long-term uptrend, caution is advised.

Reading price charts is not something that can be learned in a day. Like driving a car, you need to spend time practicing before you take to the highway. Make time to check the timeframes of multiple currency pairs each day. Look at the time period you intend to trade and take detailed notes on price history. How much movement occurred over how much time? Make conclusions and write down why you think a Buy or Sell order is favorable, then go back to previous conclusions and see if you were right or wrong.

As you learn from your mistakes, your perceptions of the market’s ebb and flow will change. Remember, the goal of this strategy is to have more profits than losses. You’ll never win them all, but there’s always room for improvement.

Test and develop your analytical skills risk-free on a demo account

Open Exness Demo Account

Open Alpari Demo Account

Open Errante Demo Account

blog24

Trading Strategies An introduction to the most popular strategies and how to choose the best one for

Trading Strategies

Having placed some random trades, you would have figured out that when you place an order to buy or sell, you could potentially earn or lose money. The theory is quite simple, pick the right direction and you will make money. The important question is how do I pick the right direction?

Strategies are a systematic and planned course of action based on existing information you know of the market. There are a multitude of strategies for Forex trading. A lot are available to learn for free by doing an Internet search, books available and people that will teach these strategies for a fee. Around the world, professional traders and recreational traders alike will always hold at least one trading strategy to heart and will attribute their success in trading to following that one or many trading strategies. The following section covers some popular strategies that are used by many traders.

The Trending Strategy

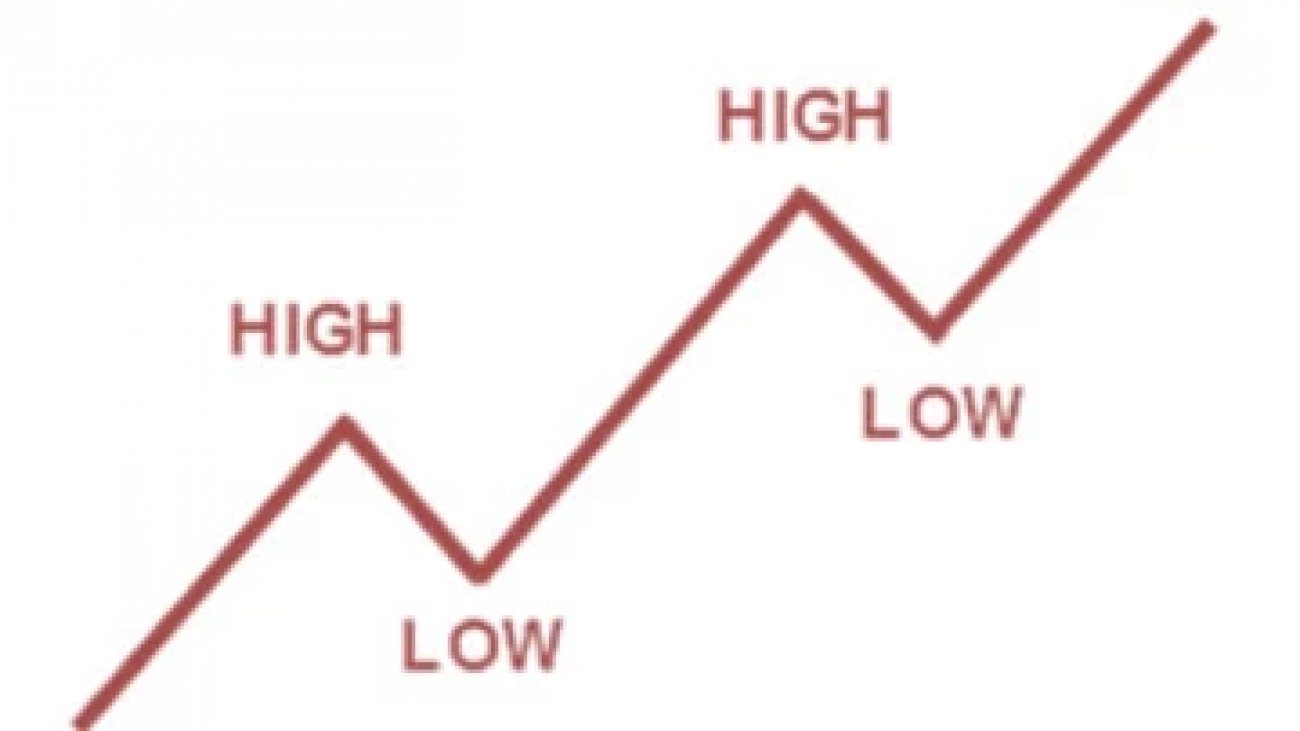
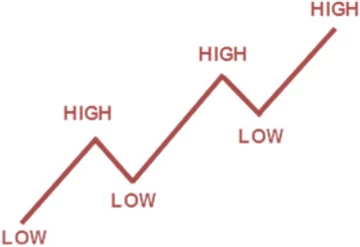
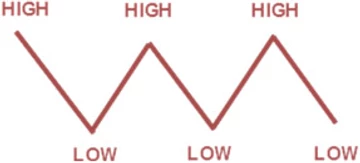
The trending strategy is to follow the market in the direction that it is clearly following over an extended period of time. Currency pairs often take either bullish (up) or bearish (down) trend.

By following the trend of a particular currency pair, you are banking on the fact that the currency continues its existing direction and you are taking in a profit by following the market direction. This strategy is by far the most popular strategy method for trading currency.

Trends can be long or they can be short, meaning that there are short-term trends and there are long-term trends. An example would be that during a 6-month period, there was a bullish trend for the AUD/USD, however, in between this 6-month period there were 2 short periods where it took a bearish trend. The following is a graphical representation of the example.

If you held a buy position from the start of the 6 months to the end, you would be well in profit. Be careful when you look for your trends. Sometimes when you look at a chart and it shows a very clear trend, if you were to expand your chart to include more data it could very well show you the opposite. As such, if you are looking for trends make sure you view the time frames of all charts.

The Ranging Strategy

The Ranging Strategy occurs when a currency is trading between a set upper and lower limit and seems to constantly bounce up and down between the high and low limit. Traders take the opportunity to sell when it is at the upper limit and to buy when it is at the lower limit. Represented in the image below, you will see a sideway trend. This marks the opportunity for people who follow a ranging strategy.

The Breakout Strategy

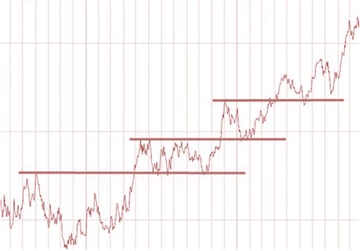
The Breakout Strategy is the break out of a sideways trend. Usually, momentum is greatest on breakout points. A lot of traders take advantage of the breakout strategy when sideways moving prices break the upper or lower limits. Below represents a few breakouts following some periods of sideways tending.

The Breakout Strategy

The Breakout Str

News Release Trading Strategy

News traders trade off economic news release. The Forex market is particularly reactive to economic news, in particular, interest rate news from the G8 countries, as well as unemployment news for each corresponding country. News traders will have to bear in mind that the Forex market movements have already taken in to consideration existing and expected economic news. The sharp movements you see due to economic news are corrections due to unexpected news, either better than expected or worse than expected.

Another consideration to take to heart for potential news traders is that during negative sentiment news reports, currency movements generally head towards lower yielding and perceived safer currencies; USD and JPY in particular.

A good grasp of economics is generally recommended for traders wishing to start news releasing trading.

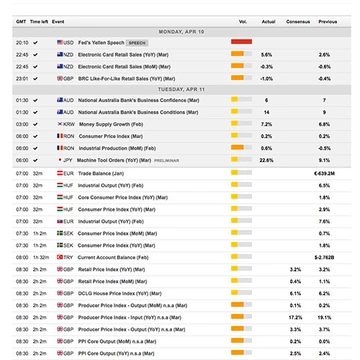
An economic news calendar is highly recommended. Forex Economic calendars show the release date for important economic news such as non-farm payroll, GDP figures and interest rate news. Below is an example of what an economic calendar shows:

ategy is the break out of a sideways trend. Usually, momentum is greatest on breakout points. A lot of traders take advantage of the breakout strategy when sideways moving prices break the upper or lower limits. Below represents a few breakouts following some periods of sideways tending.

blog11

3 More Economic Indicators You Need To Know

Forex indicators are crucial tools that can be used by all traders in order to improve to become more effective at what they do.

1. Bollinger Bands/Envelopes

Bollinger bands, also known as envelopes, were developed in the 1980s by John Bollinger to measure whether prices were high or low in relation to market volatility. Most traders use Bollinger bands to determine whether trend reversals are about to occur based on market volatility. Bollinger bands are made up of three bands with the middle band being the 20-period simple moving average of the currency pair. The values of the upper and lower bands are derived from the middle band (the upper band is calculated by adding two standard deviations from the middle while the lower band is calculated by subtracting two deviations from the middle). As a trader, you should stick to using the default values of the Bollinger bands as this is what most traders are using. Remember the price of a currency pair rarely strays far out of the Bollinger bands, which is why they are known as envelopes.

One of the most effective Bollinger bands trading strategies is the snapback to the middle band strategy, which is based on the fact that prices typically snap back to the middle band before heading in a specific direction.

2. The MACD Indicator

The term MACD indicator is an acronym for Moving Average Convergence Divergence indicator, which is a trend-following indicator used to measure momentum. Most traders use the MACD indicator to identify trend direction and to determine momentum and potential trend reversals The MACD indicator consists of the MACD line, the signal line and the MACD histogram. The MACD line and signal line move together although the MACD line is slightly faster than the signal line. As a trader, you can use the MACD indicator to generate trade signals, or to confirm trade signals generated by other trading strategies.

3. The ADX Indicator

The average directional index (ADX) indicator is used by most traders to identify whether a currency pair is trending or not. The ADX indicator was developed and introduced into the markets by J. Welles Wilder in 1978. The ADX indicator is used by forex traders to measure the strength of a trend, to identify trends and ranges, and as a filter for different trading strategies.

The ADX indicator is made up of the ADX line, the positive directional indicator (+DI) line and the negative directional indicator (-DI) line. The ADX indicator is calibrated from 0 to 100 with values above 25 indicating a strong trend while values below 25 identify ranging markets. You can also use the ADX indicator to confirm trades from other strategies as well as its own trade signals.

Conclusion

Tools like the Bollinger bands, MACD, and ADX can help you become a more effective trader and to make better trading decisions. While it is important to note that no indicator works all the time and to always apply proper risk management, learning about these three indicators is worth any new trader’s time.

Open Exness Demo Account

Open Hotforex Demo

Open FXTm Demo Account


blog10

How To Use The Parabolic SAR In Forex Trading

Have you ever wished you could tell when a trend in the forex market was likely to stop and reverse?   The parabolic stop and reverse (SAR) is an indicator designed to do just that. In this post, we’ll explore the parabolic SAR and teach you how to use it.

How The Parabolic SAR Works

The parabolic SAR typically plots dots or points on a currency pair’s chart that indicate potential areas when the price action might reverse.

When a forex chart is on an uptrend, the dots plotted by the parabolic SAR are typically below the candles. When the currency pair is in a downtrend, the reverse is true. The parabolic SAR dots usually appear close together whenever the trend is consolidating, while they are typically further apart in a strong uptrend or downtrend.

EUR/USD Chart With Parabolic SAR Indicator

It should be noted that the parabolic SAR only works in trending markets and you should not use it in choppy markets where the currency pair is trading sideways. These conditions typically generate a lot of false signals.

How To Enter And Exit Trades Using The Parabolic SAR

You can use the parabolic SAR to time your entries and exits to when a trend is about to reverse. For example, when a major uptrend is about to reverse, the parabolic SAR will typically form at least three dots above the candles to indicate that a downtrend may be about to begin. In such a case, you should exit your long trade, and enter into a short trade.

In cases where the prevailing trend is a downtrend, the parabolic SAR will typically form at least three dots below the trend to indicate that an uptrend may be about to begin. In such a case, you should exit your short trade and enter into a long trade once the parabolic SAR forms 3 dots below the candles.

Using The Parabolic SAR As A Trailing Stop

Some traders prefer to place their trailing stop loss orders at the level where a SAR dot appears within an established trend. In most cases, such a trader will rarely be stopped out of the position in a market with a strong uptrend or downtrend but will provide protection if the trend unexpectedly reverses. This can be a particularly useful feature for new traders who aren’t familiar with setting trailing stop losses in other ways.

It should be noted once again, however, that this does not work in ranging markets where the SAR typically whipsaws between positions.

Adjusting The Step

The sensitivity of the parabolic SAR is determined by the Acceleration Factor (AF), which is also known as the Step. The step is basically a multiplier that affects the rate of change or acceleration of the SAR. The default acceleration factor on the SAR is 0.02, but most charting programs allow traders to adjust this figure depending on their needs. The step has a minimum value of .01 and a maximum value of .20.

You can reduce the sensitivity of the SAR by decreasing the value of the AF, while you can increasing the parabolic SAR’s sensitivity by raising the value of the Step. When you lower the step, you move the SAR further from the price and reduce the chances of a reversal happening. By increasing the step, you move the SAR closer to the price, which increases the likelihood of a reversal.

When adding the parabolic SAR to a chart, there are two values that are required. One is the step, and the other is the maximum step. The value of the maximum step has a slight impact on the reversals identified by the SAR, but the step value carries more weight when compared to the maximum step.

Conclusion

The creator of the parabolic SAR designed it to analyse trends that last for about two to three weeks. However, this does not mean that it cannot be used on trends that last for a shorter or longer periods. We recommend you experiment with it and  test different values for the step and maximum step with a free Demo account to identify the values that allow you to ride a trend for the longest period.


Open Exness free Demo Account

Open FXTm free Demo Account