blog6

How To Use The RSI Indicator In Forex Trading

Author:Exness Broker

The relative strength index (RSI) indicator is a technical indicator that is widely used by traders to identify oversold and overbought conditions within charts. The RSI is an oscillator type of indicator that moves up and down a scale from 0 to 100 depending on market conditions. The RSI is regarded as a leading indicator, which means that it can be used to predict future price movements in a financial instrument such as a currency pair. The RSI indicator was developed by J. Welles Wilder and introduced into the markets in 1978.

Understanding The RSI’s Signals The RSI indicator is usually presented as a horizontal chart attached to the bottom of a currency pair’ chart that features a single line that oscillates between 0 and 100.When the RSI is ranging from 0-30, this generally indicates oversold market conditions with a high probability of an upward correction in price. Whenever the RSI is ranging from 30-70, this is generally regarded as neutral territory (neither overbought or oversold). An RSI reading of 70-100 generally indicates an overbought market with a high likelihood of a price correction to the downside. When the RSI crosses from below the centerline (50 level) to the area above, this usually indicates a rising price trend in the affected currency pair. When the RSI cross from above the centerline to the area below it, this usually indicates a falling price trend in the affected currency pair.

RSI Divergence Signals The Relative Strength Index indicator might also show divergence in certain situations where the RSI line trends in the opposite direction to the prevailing price action in a currency pair. This is referred to as divergence, which can either be bullish or bearish, and indicates that a price reversal might be developing.

Bullish RSI Divergence Bullish RSI divergence typically occurs whenever the price of a currency pair is declining and the RSI line is rising, which is a strong bullish signal.

Bearish RSI Divergence Bearish RSI divergence typically occurs when a currency pair’s price is trending higher and the RSI line is falling, which is a strong bearish signal.

Analyzing RSI Signals Although the RSI overbought signal occurs when the RSI line crosses over the 70 mark, the time to actually sell the currency pair is when the RSI moves out of the overbought region. This is because the price can sometimes stay in the overbought range for extended periods and this can cause major losses for a trader that jumps in too early.To put it another way, the initial cross above the 70 mark typically serves as a warning to traders that they should prepare to sell once the RSI crosses back below the 70 mark. The same case applies to the RSI oversold signal, which typically occurs once the RSI line crosses below the 30 mark. You shouldn’t actually buy until the RSI line moves out of the oversold area.Whenever you are trading with the RSI divergence indicator, always place a trade in the direction confirmed by the RSI line after the price of the currency pair has closed two to three candles in your preferred direction.

How To Place Stop Loss And Take Profit Levels When using the RSI indicator, you should ideally place your stop loss order slightly beyond the latest swing top or bottom that occurred before the price reversal that you are trading. Your ideal take profit level should be when the RSI line crosses above or below the centerline (50 level), at which point you should lock in some of your profits, if any, using a trailing stop. In some cases, the trend might reverse at or near the centerline, which is why this is a good take profit level.

A Word Of Caution Just because the RSI indicates that an overbought or oversold condition exists, you shouldn’t always expect a price reversal. A currency pair in a strong trend might stay in overbought or oversold conditions for a long time. Also, because the RSI is a leading indicator, it can generate a lot of false signals when the asset it is being used to measure displays strong trend characteristics. You should always use stop loss orders to minimize you risk exposure when trading using the RSI.

How To Calculate The RSI Although most modern trading platforms, such as the MetaTrader 4 and MetaTrader 5, can and will calculate the RSI for you automatically, understanding how these calculations are made is useful for gaining better insight into how the RSI works.

The default setting for the RSI is 14 periods.

RSI = 100 – [100 / (1 + RS)] — Where: RS (Relative Strength) = average gain / average loss

Here is how you find relative strength: calculate the gains of the last 14 reporting period and divide by zero. This is your average gain. Now find the average loss by adding up all the losses from the last 14 reporting periods and divide them by zero.

Once you have calculated the two, you divide the average gain by the average loss to find the Relative Strength (RS) and apply it to the RSI formula.

Conclusion The relative strength index indicator is a useful tool that helps traders predict reversals of existing trends. The indicator generates trading signals when overbought or oversold conditions exist as well as when bullish or bearish divergence is identified within an existing trend. Also, given that the RSI is a leading indicator, it is quite prone to generating false trading signals and should always be used together with other indicators for trade confirmations.

Found this article useful? Create a Demo account to try RSI today.

blog5

What Is The Best Forex Trading Platform For You?

Author:Exness Broker

As a trader, there are several factors that you should consider when choosing a forex trading platform. Some of these factors include your experience level, your trading preferences, and the tools you need for both technical and fundamental analysis.In this article, we shall analyze the different trading platforms offered by Exness to all its traders. Exness offers MetaTrader 4, MetaTrader 5, Mobile, WebTerminal, and MultiTerminal trading platforms.

MetaTrader 4 The MetaTrader 4 platform is one of the most popular forex trading platforms in the world and is used by millions of traders across the globe. This platform is quite easy to use and is ideal for traders getting started with forex for the first time. The MT4 platform offers 30 built-in indicators, as well as an additional 2,000 free custom indicators that any trader can download and use to perform their technical analysis.

The MT4 platform also allows traders to enter numerous types of orders depending on the market conditions, as well as allowing trading directly from the MT4 charts. The platform also allows traders to back test their trading ideas and strategies through the MT4 History Center.

MetaTrader 5 The MetaTrader 5 platform is an advanced version of the MT4 platform that offers more functionality such as the ability to execute more order types, and view the market across a wider range of time frames. This platform is well-suited to advanced traders who would benefit from the ability to build powerful EAs and sell them in the MetaTrader Market.

Mobile Platforms Given near universality of mobile devices such as smartphones and tablets, many traders are switching to mobile forex trading terminals in order to trade on the go. Although most mobile trading platforms offer limited functionality in terms of the tools available to traders, their main advantage is that they allow traders to trade wherever they are.Traders only require a stable internet connection and a mobile device that is compatible with their chosen mobile trading platforms, such as the MT4 and MT5 mobile trading platforms.

WebTerminal The WebTerminal is a trading platform that allows traders to trade directly from their web browser without having to download and install additional software. This is an excellent choice for traders who do not feel comfortable downloading trading software onto their computers, such as the MT4 or MT5 trading platforms. The WebTerminal is a stripped-down version of the downloadable trading software providing all the essential functionality with only the more advanced tools missing.

MultiTerminal The MT4 MultiTerminal is an advanced trading platform that allows traders to trade and manage different accounts. This platform is best suited for sophisticated traders with multiple accounts dedicated to trading different instruments, different strategies, or for the management of the accounts of other people.Institutional investors could also benefit greatly from this platform given their complex trading needs. The MetaTrader MultiTerminal allows traders to place new trades and allocate lots across different accounts simultaneously, which is vital for traders managing multiple accounts.

Conclusion To sum up, it is crucial to note that each of the above forex trading platforms has different functionalities that are suited to different types of traders.For most beginner traders, the MT4 platform is their best choice, although they might not utilize all of its functions. The choice of a trading platform is largely subjective and depends on a trader’s needs. The best course of action for most traders is to open a demo account in order to test their preferred trading terminal before engaging in live trading.

blog4

5 Reasons Why Most Forex Traders Start With Demo Accounts

Author:Exness Broker

Forex can be intimidating for newcomers. Often new traders don’t know where to begin, and so either rush in without a plan or alternatively decide against trying out trading at all.


Fortunately, Exness offers an ideal way for new forex traders to get started; the Demo account.

In this article, we’re going to dive into some key reasons why most traders start with Demo accounts and why it could well be the perfect way for you to try out forex trading too.

Once you’ve read the article, why not go ahead and open a Demo account for yourself with Exness

Reason One: It’s Risk Free Time and again we speak to new traders who are concerned about the levels of risk they could be exposed to when trading forex. Ultimately, risk management is a technique that needs to be learned through practice.

The best way to do this is through the Demo account. Entirely free to use, the demo account is topped up using virtual funds as many times as you want. This means that new traders can practice in a completely risk free environment, making as many mistakes as needed with zero repercussions.

The Demo account also provides access to all the functionality needed by new traders to learn risk management principles. Then, when they’re comfortable, they can graduate to real accounts with confidence.

Reason Two: It’s Unlimited Many forex trading courses in the market are closed-ended, meaning that new traders have a limited amount of time to learn before they are thrust into the real forex market to fend for themselves.

With the Exness Demo account, however, traders can experiment and learn for as long as they want. If the account runs out of virtual funds, it can simply be topped up in seconds for free.

What’s more, traders can open as many Demo accounts at no cost. This means that they can experiment with strategies, currency pairs, and more across multiple accounts. This allows you to discover for yourself which approaches work best.

Reason Three: Real Trading Conditions Demo trading can be incredibly educational, but only if the trading conditions included are the same as you’d find when trading forex for real. The last thing you want is to gain lots of experience with a Demo account, only to find that the real accounts feature completely different dynamics.

With the Exness Demo accounts, you will trade under virtually the same conditions as one of our real accounts. This allows you to get a sense of what live currency movement across 120+ instruments are like. It also allows you to explore the use of features such as leverage, margin, and spread.

With the Demo account, traders can also try out different account types to find out which one is best for them. These includeMini, Classic, and ECN. Each account has different benefits, and so creating a Demo version is an ideal way to test them out.

Reason Four: Experimentation With the Demo account, you can make use of all the same tools, as well as the same currency pairs, that are accessible with real accounts, meaning you can directly transplant strategies developed in Demo over to one of the real accounts when you’re ready.

One of the major outcomes of this is that many well established traders still operate Demo accounts. They do so because they still need a safe space in which to experiment with new strategies and approaches. Say for example a trader decides to try out a indicator. Either they can do so in the real market, and possibly risk significant amounts of capital, or alternatively can do so in Demo, risk free.

As you develop your skills as a trader, the Demo account will always be there for you to experiment with.

Reason Five: Expert Advisors Expert Advisors (EAs) are one of the great benefits of trading with the MetaTrader 4 and MetaTrader 5 platforms through Exness, and with Demo accounts you can test and experiment with them to your heart’s content.

Essentially computer programs written by experienced traders, EAs can make trading decisions for you based on historic price data analysis. While EAs allow many traders to take a hands-off approach to trading, they are not without their failings. Using EAs means you put your money in the hands of an algorithm, and you should absolutely test it out before you commit to using it for real.

With the Exness Demo account you can use EAs in exactly the same way as you would with a real account. With new EAs being developed all the time by the MetaTrader community, the Demo account is the perfect place to find the right one for you.

Conclusion The Demo account is a great tool for new and experienced traders alike who are looking to develop their skills, experiment with new strategies, and test EAs, all within a completely risk-free environment.

Open a Demo account today and start your forex trading journey the right way!

blog3-1

Retracement in Forex Trading

Learn Forex Trading

Author: Andreas Thalassinos

Leonardo Fibonacci, an Italian mathematician from Pisa, is credited with introducing the Hindu-Arabic numeral system to Europe during the Middle Ages. In his book, Liber Abaci or ‘Book of Calculation’, he also introduced an influential sequence of figures which have come to be known as the Fibonacci numbers.

The relationship between the numbers in this sequence (i.e. the ratio) is not just interesting on a theoretical level. It appears frequently around us in the physical world and is integral for maintaining balance in nature and architecture. It is also important in the financial markets; many traders use Fibonacci ratios to calculate support and resistance levels in their forex trading strategies.

What is the Fibonacci sequence?

Each number in the Fibonacci sequence is calculated by adding together the two previous numbers.

1 1 2 3 5 8 13 21 34 55 89 144 233 377 …and so on to infinity

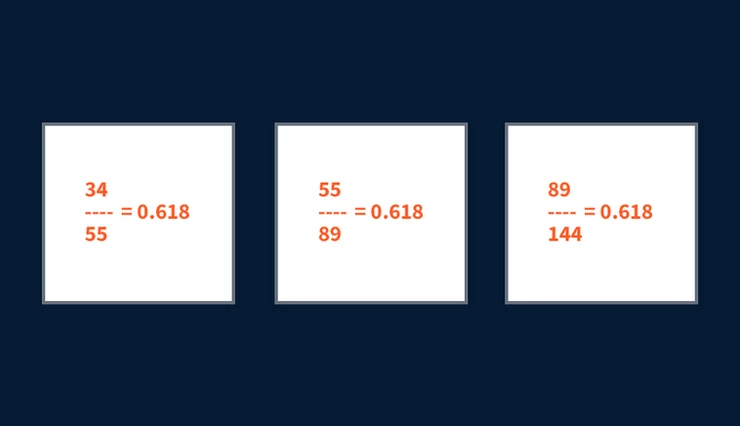
What is significant about this pattern, however, is that the ratio of any number to the next one in the sequence tends to be 0.618.

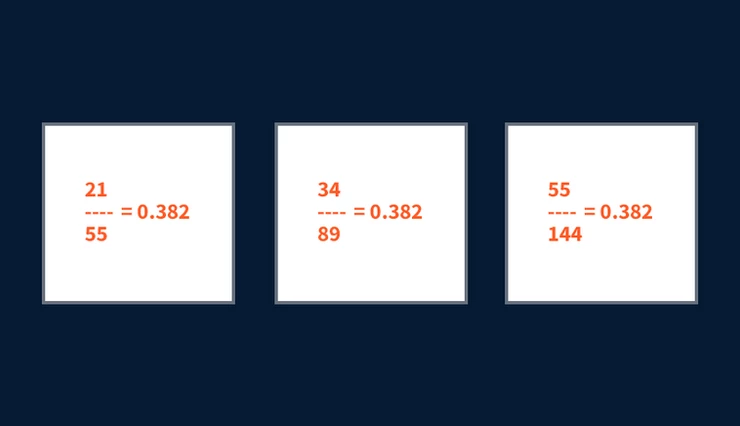
Furthermore, the ratio of any number to the number two places ahead in the sequence is always 0.382.


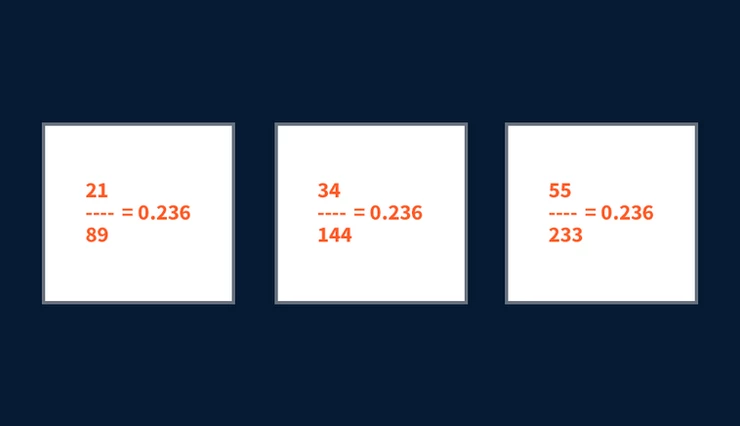
Similarly, the ratio of any number to the number three places ahead tends to be 0.236.


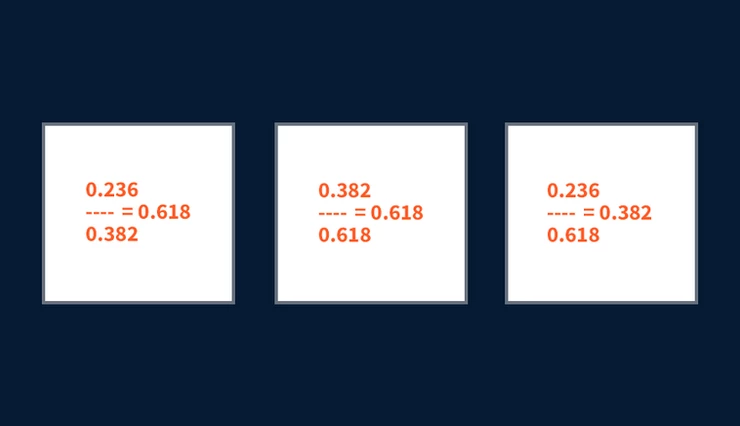
These ratios are commonly known as Fibonacci ratios.

Dividing these Fibonacci ratios will result in either 0.618 or 0.382:

How Fibonacci retracement works

In trading, these ratios are also known as retracement levels. Traders wait for prices to approach these Fibonacci levels and act according to their strategy. Usually, they look for a reversal signal on these widely watched retracement levels before opening their positions. The most commonly used of the three levels is the 0.618 – the inverse of the golden ratio (1.618), denoted in mathematics by the Greek letter φ.

How to draw Fibonacci retracement levels

Drawing Fibonacci retracement levels is a simple three-step process:

In an uptrend:

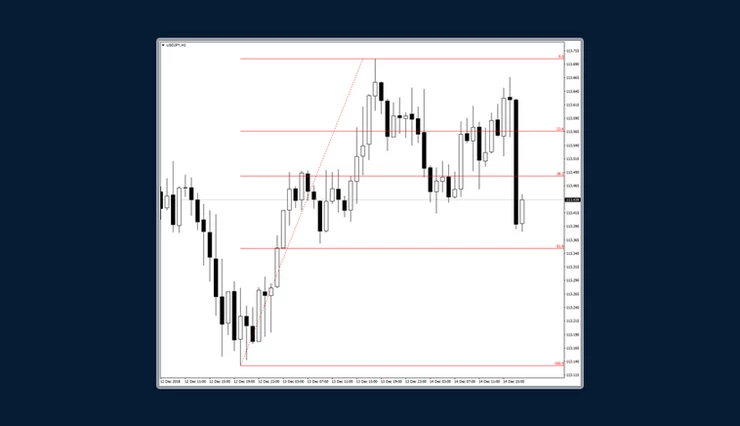
Step 1 – Identify the direction of the market: uptrendStep 2 – Attach the Fibonacci retracement tool on the bottom and drag it to the right, all the way to the topStep 3 – Monitor the three potential support levels: 0.236, 0.382 and 0.618

In a downtrend:

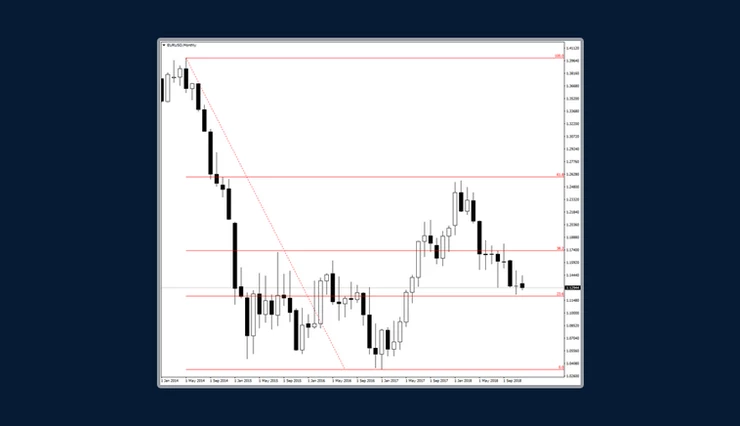
Step 1 – Identify the direction of the market: downtrendStep 2 – Attach the Fibonacci retracement tool on the top and drag it to the right, all the way to the bottomStep 3 – Monitor the three potential resistance levels: 0.236, 0.382 and 0.618

Of course, it is more reliable to look for a confluence of signals (i.e. more reasons to take action on a position). Don’t fall into the trap of assuming that just because the price reached a Fibonacci level the market will automatically reverse.

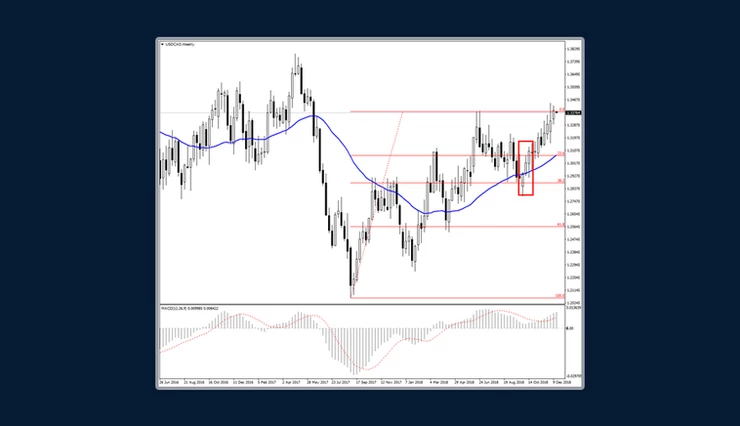
Combine Fibonacci levels with Japanese Candlestick patterns, Oscillators and Indicators for a stronger signal. As you can see in the chart below, the “Three White Soldiers” pattern is confirmed by the fact that prices are trading above the Moving Average line, and additionally that the MACD (Moving Average/Convergence Divergence) is above the zero line.

Trading using Fibonacci retracements

Every trader, especially beginners, dreams of mastering the Fibonacci theory. A lot of traders use it to identify potential support and resistance levels on a price chart which suggests reversal is likely. Many enter the market just because the price has reached one of the Fibonacci ratios on the chart. That is not enough! It is better to look for more signals before entering the market, such as reversal Japanese Candlestick formations or Oscillators crossing the base line or even a Moving Average confirming your decision.


Learn to trade with FXTM

Discover how to make the right trading decisions for your style and goals with our comprehensive range of educational resources. open a demo account and try your skill!

blog2-1

Bitcoin Technology: Under the Hood

Learn Forex Trading

Author: Andreas Thalassinos

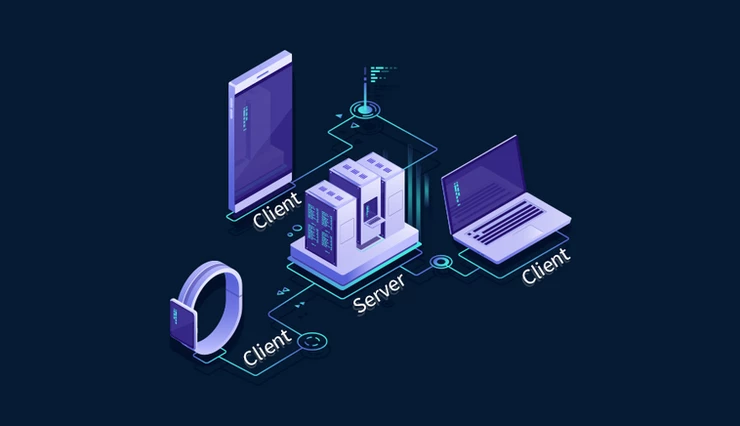
In 2008, Satoshi Nakamoto proposed a peer-to-peer cash payment system that would allow people to transact directly with each other, without the need of financial institutions. Since then a lot has been said and written about bitcoin, the new digital currency. The purpose of this article is to shed some light on the jargon surrounding the technology and, more specifically, the computer network that facilitates the payment system.In computer networks there are usually two main models: client/server and peer-to-peer. The difference is the role and functionality of each participating computer (or node, as it is usually called).

Client/Server

In a client/server model, there are two discrete entities; the server and the clients. This is a centralized environment where the applications, files and other resources are stored on a central computer – the server. The server acts as a central authority that provides services to the rest of the nodes in the network. It shares information and resources with the clients. All clients are connected to the central server. This model is prone to security breaches, hacks and breakdowns as the server constitutes a single point of failure. If the server is faulty, it can bring the whole network down.

Peer-to-Peer (P2P)

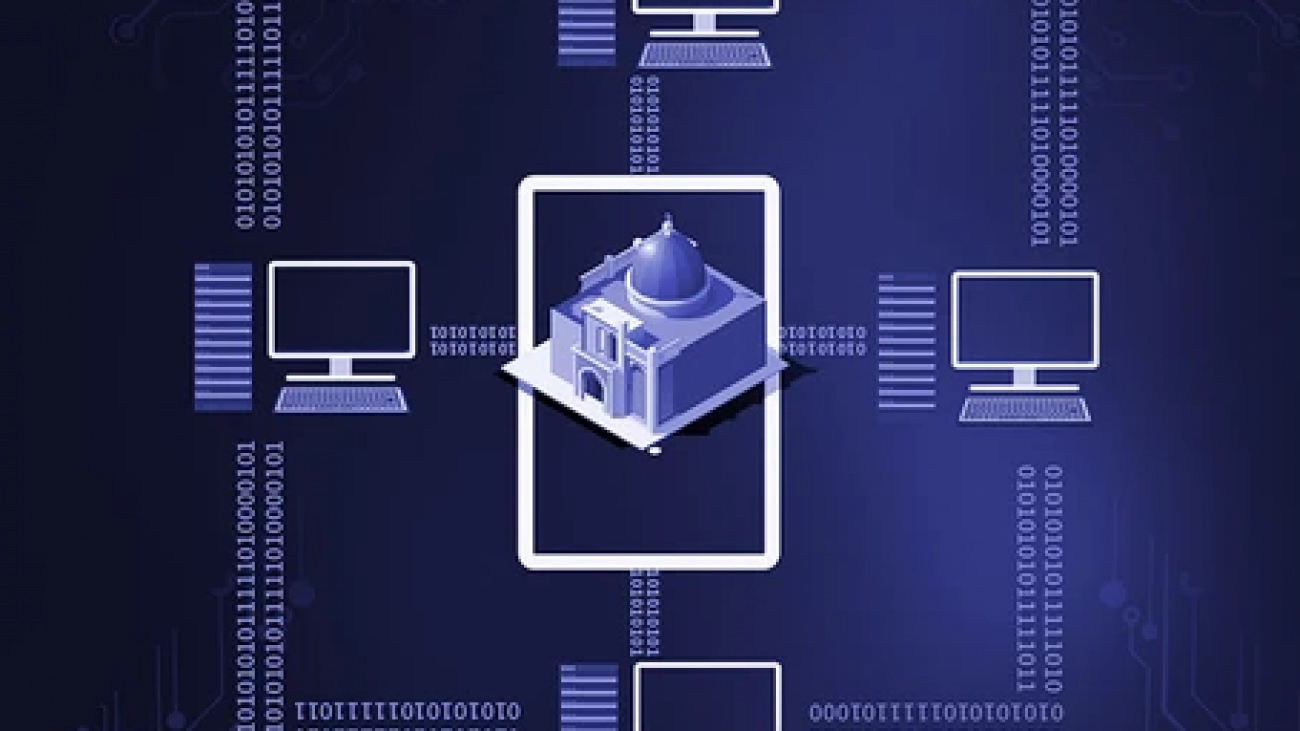
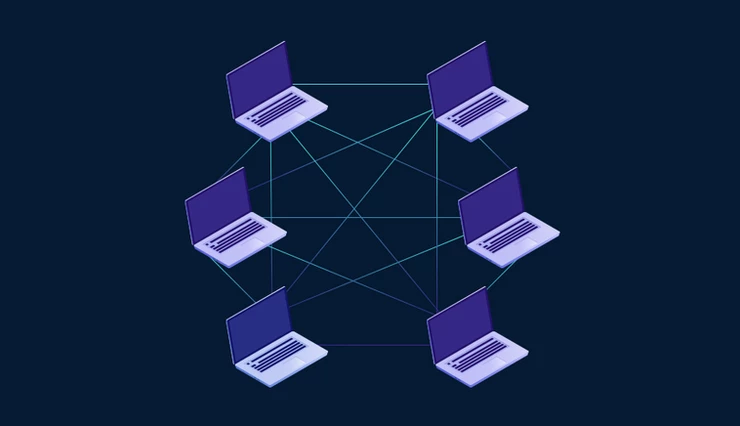
On the other hand, a peer-to-peer network is a decentralized model – in other words, there is no central authority or server. Instead, each node acts as both server and client, where all nodes are equal. BitTorrent is perhaps one of the most popular P2P networks for file sharing. While peers are vulnerable to security attacks (which the Bitcoin network takes care of through its protocols), the advantage is that scalability is easy. A new computer may be plugged into the network and be up and running once in sync with the network.

As the network expands, its computational power expands as well. Furthermore, a faulty computer will not jeopardize the integrity of the network. All computers are interconnected and communicate with each other constantly – this way, the propagation of messages continue uninterrupted. This is perhaps the greatest advantage P2P has – it’s a fault tolerant network.

Distributed System

The Bitcoin network follows a distributed application model, where the work load is spread among the participating nodes. When “digging” into computer networks, one will come across the Byzantine Generals Problem where consensus is the goal. In order to maintain reliability in the network, consensus must be reached among the participating computers. 100% consensus is, of course, ideal but not always feasible.

Byzantine Generals Problem

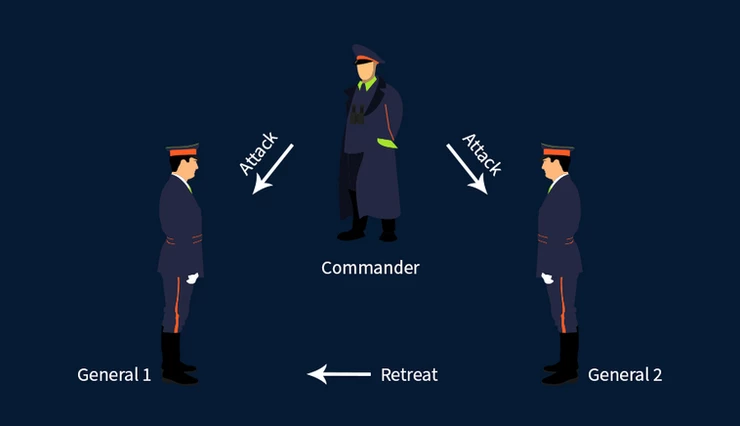
A group of Generals have surrounded an enemy city. They have to attack or retreat based on the Commanding General’s orders. It is imperative for the success of the campaign that there exists consensus among the Generals. Messages are passed from the Commanding General to the Generals through unsecure and penetrable networks. Even worse, a number of the Generals and/or even the Commanding General himself may be traitorous. As long as the Commander is loyal and the number of traitors is not greater than one third of the Generals, then consensus may be reached to attack or retreat at the same time.

In a nutshell, there must be 3t + 1 Generals where t represents the number of traitors.

It is obvious that General 1 will receive contradictory information from the Commander and General 2, who happens to be a traitor. In this scenario, it is not possible to achieve consensus (which is more than 50% in favor of attack or retreat).

The Bitcoin system faces the same type of problems as the Byzantine Generals. In order to bypass it, Satoshi Nakamoto introduced the proof-of-work concept. When sending a message, the message is hashed and a nonce is sent to all nodes to verify the proof-of-work. Every message (i.e. block) is chained and as a result it is close to impossible to tamper with it.

Conclusion

Bitcoin follows a decentralized, peer-to-peer networking and distribution model. Consensus is needed among the nodes to ensure smooth operation of the network. A number of “bad” nodes are not capable of altering the blockchain due to the implementation of proof-of-work.

Open a Demo account and test your skill.


.